When is the Mean Reversion Coming in the Stock Market?
I posted the following on Twitter this week:
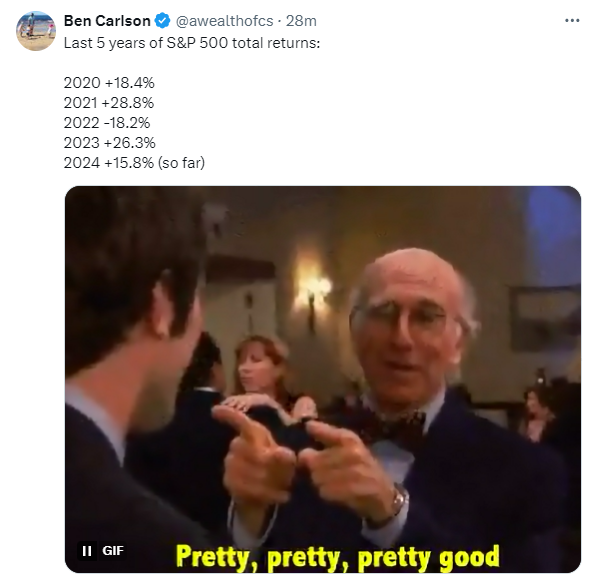
It’s turning into another banner year for the U.S. stock market (so far).
Here’s a good follow-up question on these numbers:

This is a legitimate concern.
Since 2020 the S&P 500 has compounded at more than 14% per year. That’s not just a pandemic phenomenon either. Since the start of 2009, the S&P 500 has seen returns of 14.5% per year.
From the bottom in early March 2009, the S&P is up nearly 17% per year.1
Trees don’t grow to the sky. Above-average returns are followed by below-average returns, and vice versa. That’s how averages work.
The U.S. stock market can’t keep this up forever. Mean reversion will rear its ugly head eventually…right?
I’m confident this will happen at some point. Markets are always and forever cyclical because the economy is cyclical and human nature is cyclical.
Peter Bernstein has an excellent chapter on the challenges of mean reversion in his classic book about risk, Against the Gods:
Regression to the mean provides many decision-making systems with their philosophical underpinnings. And for good reason. There are few occasions in life when the large are likely to become infinitely large or when the small are likely to become infinitely small. Trees never reach the sky. When we are tempted–as we so often are–to extrapolate past trends into the future, we should remember Galton’s peapods. Yet if regression to the mean follows such a constant pattern, why is forecasting such a frustrating activity? Why can’t we all be as prescient as Joseph in his dealings with Pharaoh? The simplest answer is that the forces at work in nature are not the same as the forces at work in the human psyche. The accuracy of most forecasts depends on decisions being made by people rather than by Mother Nature. Mother Nature, with all her vagaries, is a lot more dependable than a group of human beings trying to make up their minds about something.
You can’t set your watch for regression to the mean because the mean can change over time, there are fluctuations around the mean and the market environment is always different.
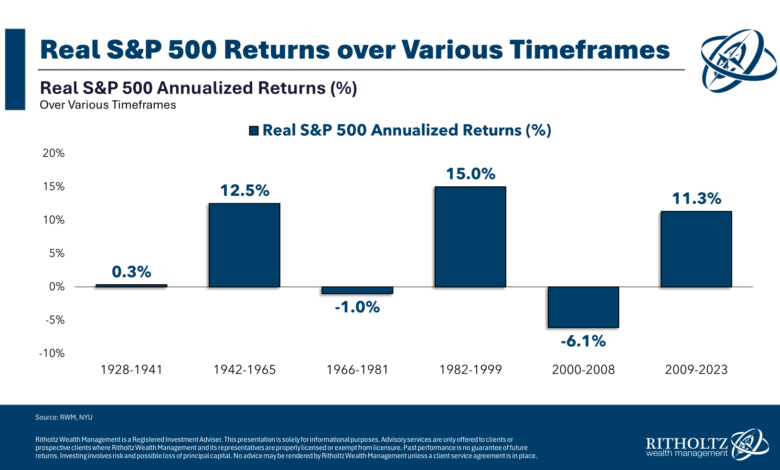
However, if we look back at the historical track record of the U.S. stock market, there are clear cycles of above-average and below-average performance.
Here’s a look at some of the longer-term cycles going back to the late-1920s using inflation-adjusted returns2 on the S&P 500:
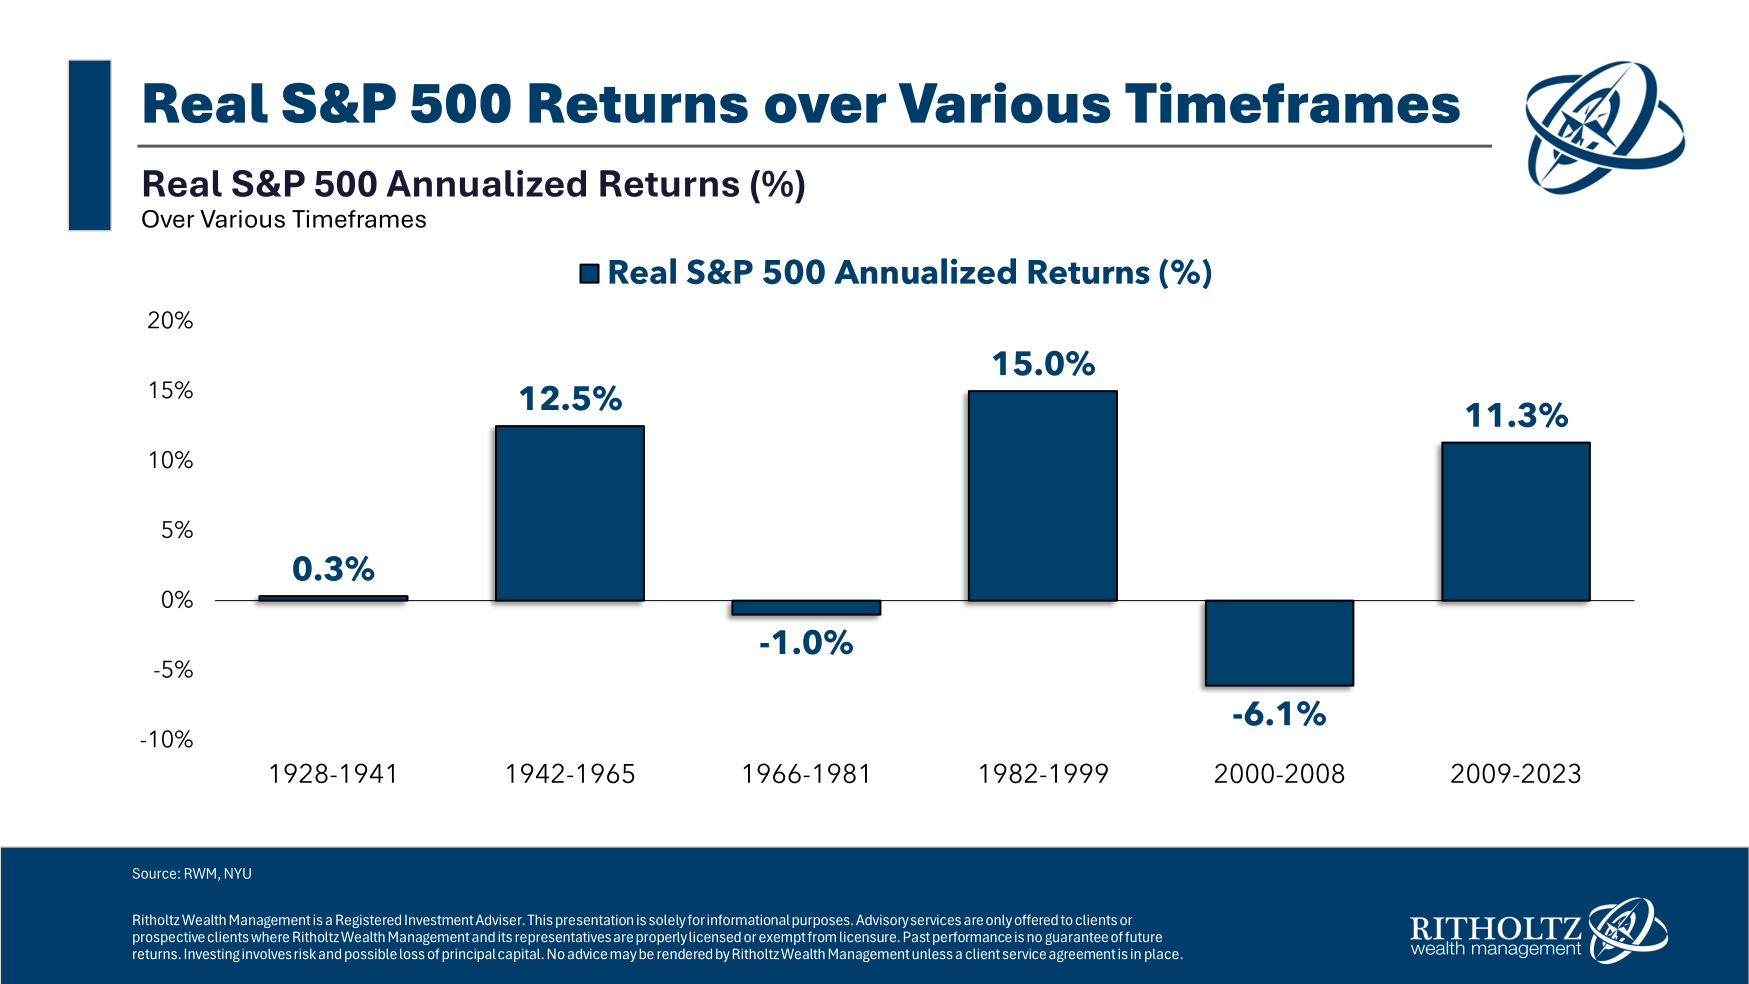
I cherry-picked the start and end dates to make a point here but you can see there have been some dreadful cycles and some spectacular runs.
All you have to do is avoid the drawn-out down cycles and go all-in during the bull markets. Simple, right?
The hard part about investing is that no one really knows what the difference between a cyclical and secular bull market is in real-time.
Investors thought we were going into a depression when the 1987 Black Monday crash hit. No one could have known the bull market still had another dozen years or so to run at that time.
The fantastic run in the 1940s started during World War II. From 1942 to 1965 there were 13 separate double-digit corrections in the U.S. stock market, including four bear markets with losses in excess of 20%.
In the current bull market we’ve seen eight double-digit corrections. Two of those corrections were bear markets with drawdowns of -34% and -25%, respectively.
Even the terrible times have their moments.
During the awful inflation of the 1970s, the S&P 500 was up more than 260% in total from 1975-1980.
Sandwiched between the dot-com crash and the Great Financial Crisis was a respectable 81% total return (12.7% annualized) from 2003 to 2007.
The 1930s were a dreadful economic environment but the U.S. stock market was up 140% from 1933 to 1938 before taking a dive when the war started a year later.
It’s much easier to define secular markets after the fact than it is in the moment.
Returns will slow at some point. I just don’t know when and I don’t know why, which is why I diversify.
Further Reading:
Long-Term Recency Bias
1The Nasdaq 100 is up a blistering 22.2% per year from the bottom.
2I used real returns here mainly because of the 1970s when nominal returns were decent but inflation was even higher.
This content, which contains security-related opinions and/or information, is provided for informational purposes only and should not be relied upon in any manner as professional advice, or an endorsement of any practices, products or services. There can be no guarantees or assurances that the views expressed here will be applicable for any particular facts or circumstances, and should not be relied upon in any manner. You should consult your own advisers as to legal, business, tax, and other related matters concerning any investment.
The commentary in this “post” (including any related blog, podcasts, videos, and social media) reflects the personal opinions, viewpoints, and analyses of the Ritholtz Wealth Management employees providing such comments, and should not be regarded the views of Ritholtz Wealth Management LLC. or its respective affiliates or as a description of advisory services provided by Ritholtz Wealth Management or performance returns of any Ritholtz Wealth Management Investments client.
References to any securities or digital assets, or performance data, are for illustrative purposes only and do not constitute an investment recommendation or offer to provide investment advisory services. Charts and graphs provided within are for informational purposes solely and should not be relied upon when making any investment decision. Past performance is not indicative of future results. The content speaks only as of the date indicated. Any projections, estimates, forecasts, targets, prospects, and/or opinions expressed in these materials are subject to change without notice and may differ or be contrary to opinions expressed by others.
The Compound Media, Inc., an affiliate of Ritholtz Wealth Management, receives payment from various entities for advertisements in affiliated podcasts, blogs and emails. Inclusion of such advertisements does not constitute or imply endorsement, sponsorship or recommendation thereof, or any affiliation therewith, by the Content Creator or by Ritholtz Wealth Management or any of its employees. Investments in securities involve the risk of loss. For additional advertisement disclaimers see here: https://www.ritholtzwealth.com/advertising-disclaimers
Please see disclosures here.