Precious Metals: Did Gold, Silver Decline Change Bullish Trend?
While we never profess buying a falling knife, we do believe that the metals are probably setting up for a buyable dip this coming week.
Why?
Looking at the fundamentals, it seems nothing has significantly changed.
The news story that China paused buying gold after an 18-month buying spree could be nothing more than smart trading.
After all, the dollar rose Friday along with yields, and China has been a seller of both.
Hence, selling the dollar and yields higher whilst buying gold cheaper is timely.
Is China, though, done completely?
Maybe.
However, let’s look at some other factors which have not changed at all.
- Geopolitics-in fact, one could say that Russia sending war ships towards Cuba is yet another concerning factor to add to the list of concerning factors.
- Government debt-still rising
- Government spending-still rising
- Freight costs-still high along with sticky service inflation and now, higher wages
- AI and EVs-not going away with only more stress inevitable on raw materials
Now add to the list
- ECB and Canada cutting rates-de-globalization or just first before the US joins in?
- Even higher for longer-that’s nothing new
- Weather-with hurricane season upon us shortly, rising sea temps and heat and floods/drought-don’t underestimate Mother Nature
Which means to us that if the fundamentals remain intact, we must go to the charts for market timing.
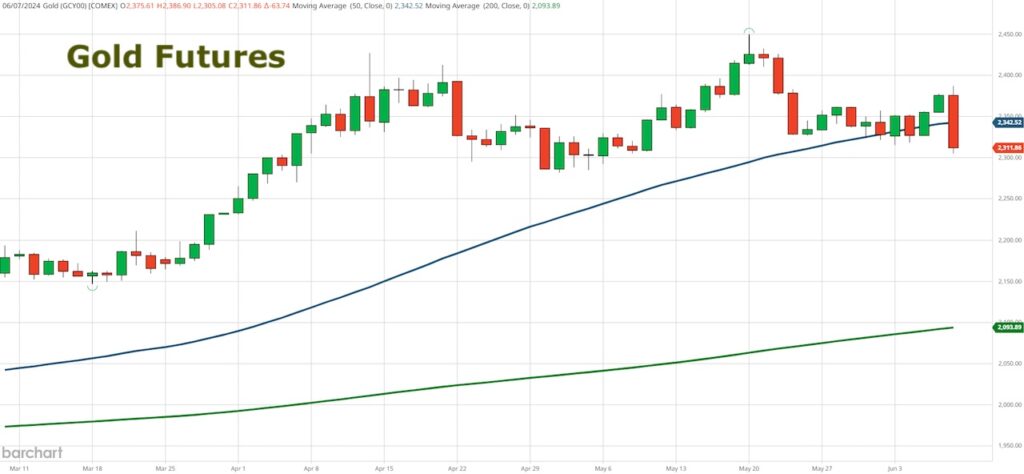
The gold cash chart goes back to March.
We had said that gold was a hold your nose and buy once it cleared $2100. The high since then is just shy of $2450.
Then, after gold made that high on May 20th, the next day was an inside day (price remains inside the trading range of the day prior).
That was proceeded by a down day, which put $2450 as a top.
Corrections on such types of chart patterns (brick wall) generally yield a 5-10% drop in prices.
5% is around $2330 and 10% $2200.
Only a move under $2100 would suggest failure and not just correction.
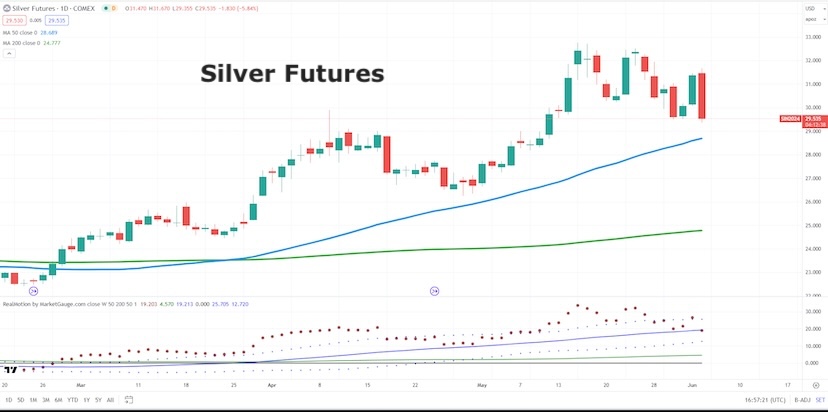
Silver looks better.
Silver futures did not have a reversal top.
Silver did not fail the 50-DMA.
Silver has returned to major support above $29.00
Silver looks compelling this week if holds above $29.50
Twitter: @marketminute
The author may have a position in mentioned securities at the time of publication. Any opinions expressed herein are solely those of the author and do not represent the views or opinions of any other person or entity.