Has the US really diverted green investment from Europe?

First, a quick follow-up on last week’s Free Lunch, on why non-western central banks would find it impossible to dump western assets en masse. One reader asked: what about gold? I would say that for the existing foreign exchange reserves, the same issue arises: you need to buy the gold from someone. If you buy it from non-western investors, the exposure to the western seizure remains. If you buy it from western ones, congratulations: you have given western investors a windfall and given western economies a bigger domestic investor base.
Today, I want to kick the tyres on another piece of conventional wisdom that seems to be driving a lot of policy. It is the idea that Europe is losing out to the US in “competitiveness” generally and in green industrial policy specifically. Politicians and policymakers seem to take it as axiomatic that Washington’s recent moves to subsidise green tech and chipmaking have made the US a much more attractive investment destination than Europe, whose industrialists tell their political leaders that they are reorienting their investment plans across the Atlantic.
But a lot of the debate seems based on nothing more than precisely what European industrialists are telling politicians. As I said, this narrative is axiomatic, which is a different way of saying fact-free. So I thought I would dig into the numbers on investment flows in and out of the US and Europe.
It is surprisingly difficult to get a good handle on investment numbers. Such flows are hard to keep track of, even though national statistics authorities do their best. So do the folks over at fDi Intelligence, a data and analysis service that is part of the FT Group. They collect all the information they can on greenfield cross-border investment projects announced by companies. The result is fDi Markets, an FT-owned database that has tracked such investment announcements since 2003.
Their latest data is summarised in their fresh-off-the-press annual report. I asked them to extract details on EU and US foreign direct investment, especially in the green tech area, and here are the highlights of what they gave me.
First of all, announced FDI into the EU has soared in recent years. That is true, in particular, of FDI into renewables as well as into chipmaking and other electronics. Not only that, bilateral FDI announced by US-sourced investors into the EU has grown significantly as well. It was particularly high in 2021 and 2022.
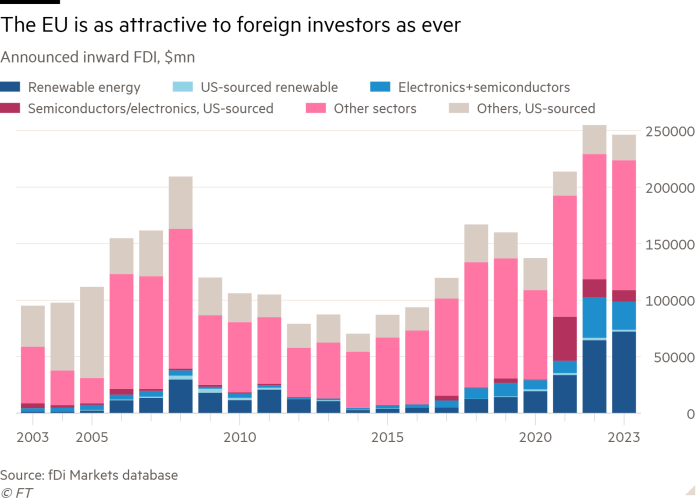
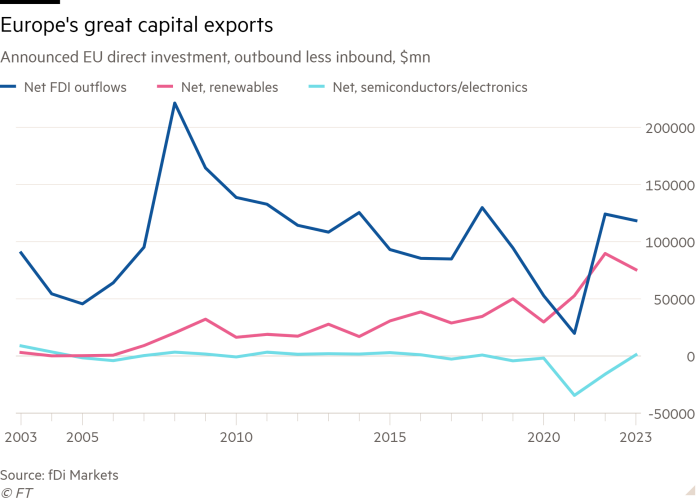
Second, announced outbound FDI from the EU is also high — and consistently bigger than inward FDI, which makes sense for a large surplus economy that by definition invests more abroad than it receives investments from foreigners. Outbound FDI announcements have grown fast, albeit not as fast as inbound ones. The chart below shows the balance over time (outbound less inbound announced EU FDI). In the renewables sector, however, outbound FDI has grown much faster than inbound FDI. In electronics and semiconductors, outbound and inbound announcements have stayed balanced.
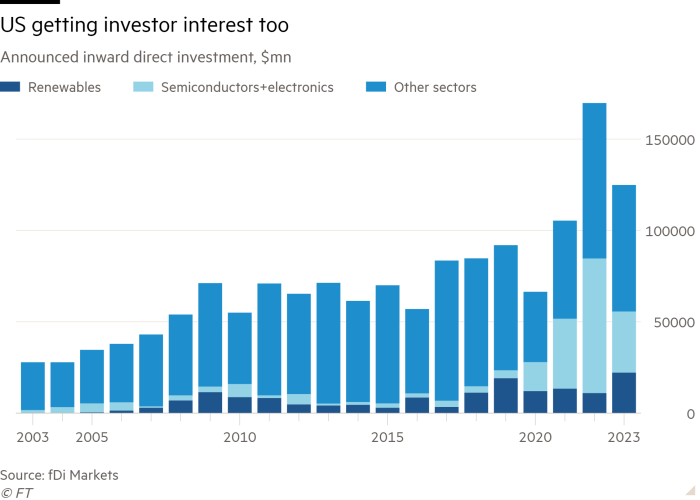
What about the US? The chart below leaves no doubt that FDI into the US, too, has had a good few years. But the action is much more in semiconductors and electronics than in renewables (so much for European panic around the Inflation Reduction Act). In fact, there is little to show for in bilateral EU-to-US direct investment — I have not bothered to put in the EU share of the two sectors highlighted in the chart, as they would barely show. Most outbound direct investment announced by EU companies, it seems, goes to other places than the US, and what goes to the US goes mostly to other sectors.
To sum it up then, it would seem that there has been a lot of crying wolf by European industrialists. A lot of investment capital is flowing out of the EU, but the amount flowing in has significantly increased as well. The US investment boom, meanwhile, seems mostly homegrown, not stealing other countries’ investments.
There are some big caveats with the fDi Markets data, however, since the information is all based on what companies have announced. So it’s missing what’s not announced, it runs a risk of double-counting when companies rebrand past commitments as new, and it counts things when announced that may in the end materialise on a very different scale. In addition, it locates investment sources by headquarters location, so it would not pick up, for example, cross-border portfolio (financial) investment into a local entity that then announces the greenfield physical investment as a domestic project.
So it’s necessary to cross-check the picture from fDi Markets with national accounts and balance of payments data.
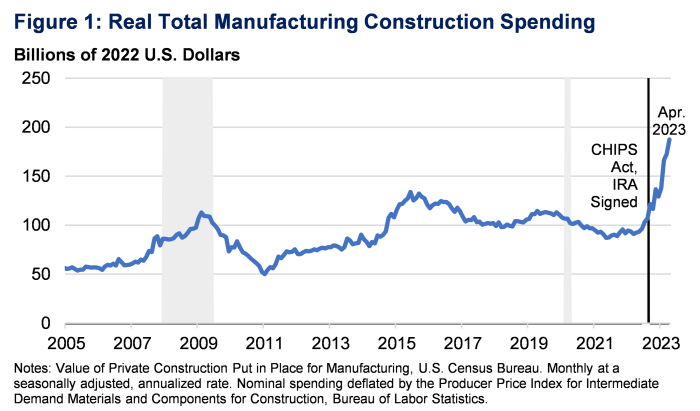
The chart below, from the US Treasury, has received a lot of attention: it shows US investment in factory construction soared after the passage of the Biden administration’s subsidy programmes. (The Treasury has boasted about booming foreign investment in factory building, but what’s most striking about its analysis is that the number is so small — in the single-digit billions. Most of the factory construction boom is domestically financed.)
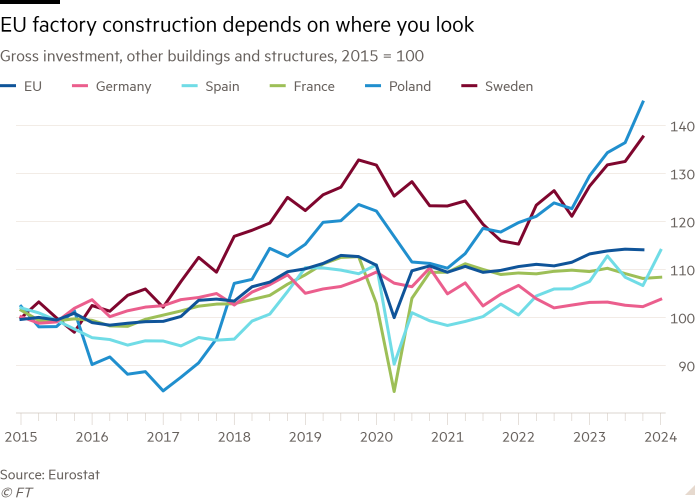
I have been looking for an equivalent chart for the EU. The closest I have found is data for construction in “other buildings and structures” (other than “dwellings”, that is), which I have charted below. The big story is that there is no big change to spot at EU level — in other words, none of the drop-off you would imagine if businesses scratched factory projects in Europe to build in the US instead. In fact, there has been a modest increase — not in France or Germany, but sizeable jumps in Poland and Sweden, and even in Italy and Spain. The lesson is to pay attention to which countries the complaints are coming from.
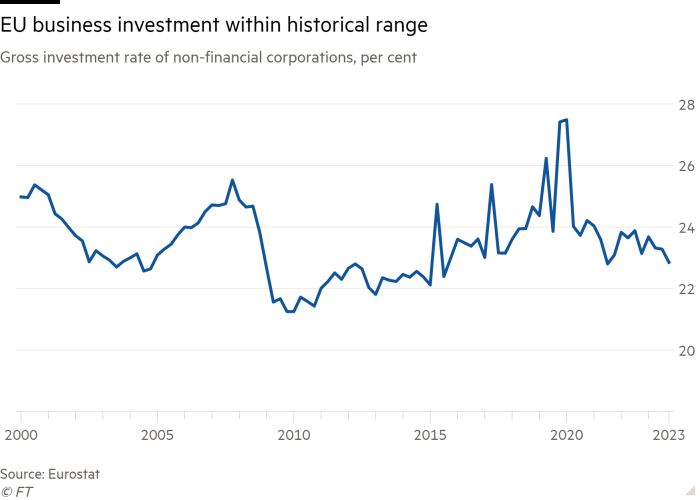
What about broader business investment? The investment rate of EU non-financial corporations — the share of their value added that they invest — has remained stable since the pandemic shock. It is even reasonably high when seen in light of the historical average, if not as high as it has been at times of strong demand and full employment, such as at the end of the previous decade.
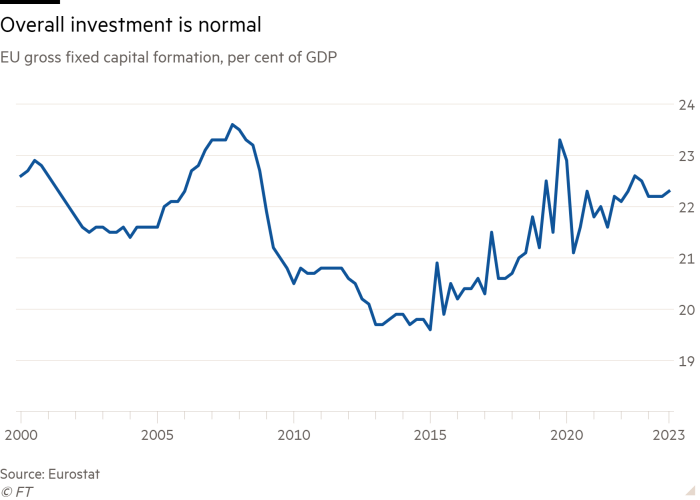
We can even look at the broadest measure of investments, which includes things such as housebuilding and is expressed as a share of the whole economy (not just the corporate part). This has recently been stable at about 22 per cent of GDP — a percentage point or two more than in the slow-growing 2010s, but slightly below what it was in a previous boom, in the mid-2000s.
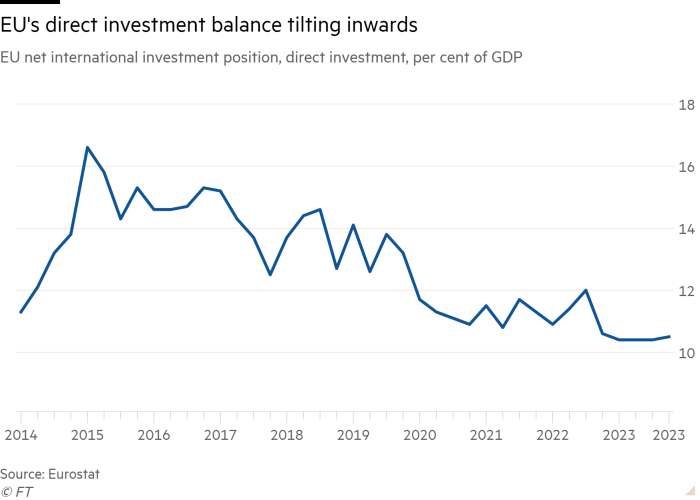
Finally, can we glean anything from official balance of payments information? The measured direct investment flows jump around a lot from period to period, and are only available up to 2022 and on a yearly basis. But looking at the total accumulated amount of directly invested capital, the net international FDI position of the EU has not changed much since the pandemic. It is slightly lower than in the previous decade, meaning there has been a slight shift in the direction of inward rather than outward investment flows. The change is tiny, but for what it is worth, it means a marginal improvement in the relative attractiveness of EU direct investment.
What do all these numbers tell us? First, that while US policy moves may well have jump-started investments across the Atlantic, there is no evidence that this has diverted capital from Europe. In fact, investment in the EU has been stable overall, while direct investment announcements from outside the bloc have grown strongly, especially in the most favoured sectors of renewables and semiconductors/electronics. EU leaders should not be too downcast: their policy framework is doing a decent job. But they can’t rest on any laurels, since investment rates are still far too low for the economic transformation they claim to want.
Second, the post-pandemic years have seen voluminous announcements of investments by EU residents in projects elsewhere (just not so much in the US). But the capital in question may have been raised abroad, too, given that there is little change in the overall net investment position vis-à-vis the rest of the world.
Third, if there are capital outflows (whether portfolio/financial or direct investments), that should be no surprise: it is a necessary consequence of the EU economy’s large surpluses. Enrico Letta’s report complained that EU savers collectively send €300bn out of the bloc every year, which primarily end up financing Americans. French President Emmanuel Macron repeated this finding in his recent Europe speech. Both were too tactful to point out the link with the more than €300bn-a-year export surplus. Investing more at home means shrinking that surplus — not by exporting less, but by stimulating much more capital investment at home, and letting imports rise to satisfy the consumption that would otherwise have to be given up to shift resources into investments. The EU will advance when it finally realises that you can boost investment or your trade balance — but if you try to do both, you will fail.
Other readables
My data colleagues have built an amazing seat projection tool for the UK general election. If it’s right, current polling would translate into a huge Labour majority.
The Peterson Institute’s Jacob Kirkegaard has an excellent report setting out all the aspects of EU-China trade and investment developments in electric vehicles. TL;DR: it’s nuanced, and there are reasons to hope for a thriving collaborative relationship.
This is how you do it: Estonia has passed a law allowing for the confiscation of Russian sovereign assets for the benefit of Ukraine. Not that the country has many such assets — but it’s an important demonstration that this is practically and legally doable.
You can now see how the fibre cable connecting the Arctic archipelago of Svalbard to the European mainland, which broke under suspicious circumstances, looked when it was finally hauled out of the water.