Comus Investment Q4 2023 Letter

Teera Konakan
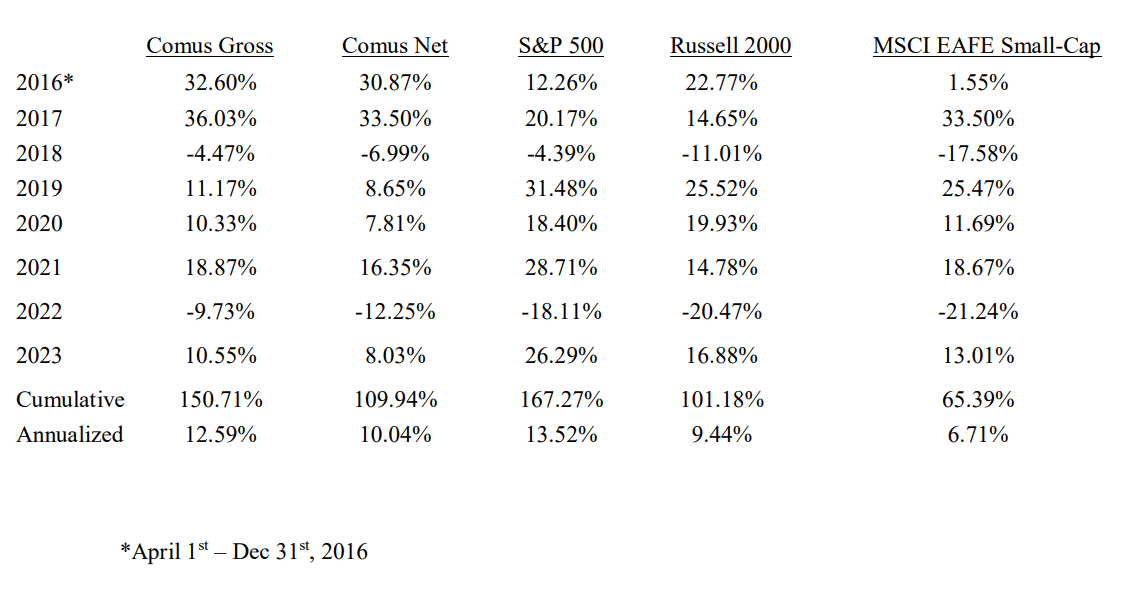
The compounded performance figures represent all realized and unrealized losses and gains in the firm’s brokerage account after commissions and on a currency-adjusted basis over the specified period, as recorded by InteractiveBrokers. Index returns represent total return including dividends.
Dear Partners,
In the fourth quarter of 2023, our investments experienced a total return of 1.26% before fees and 0.63% after fees, versus 11.69% for the S&P 500 index. For the year, we were up 8.03% after fees vs 26.29% for the S&P 500. At this point, you will have received reports with the details on your balance, fees, holdings, and performance from InteractiveBrokers for the past quarter.
An acceleration of losses in Hong-Kong coincided with a remarkable quarter for American stocks to mark the longest and deepest drawdown since the Hang-Seng index was created in 1969. Investing in a market notching a 50% drawdown in three years hasn’t been a pleasant experience, particularly when this twice a century event comes with an equally rare and exceptional period for U.S. mega-cap equities, to which every other asset class is now compared regardless of geography or size. I invested in our specific HK microcaps for the cheap shares rather than as an economic or political bet, but with 80% of HK-listed stocks falling in 2023, it has become a referendum on the entire market, as global funds pulled out at record pace in Q4. The vehement but understandable opposition to stocks in Greater China comes with hypocrisy, as most American multinationals either have stakes in Chinese-mainland joint ventures or depend on sourcing from the region. Until this week Apple was the most valuable company in the world and investors don’t seem to mind that most of its sourcing and manufacturing occurs in China.
Various equity markets are at differing ends of their cycles, and as a result are likely to experience varying patterns of returns. To be sure, it will be tough to make a substantial profit in 2024 if HK stocks drop another 25%, but the hope (which might now be viewed as wide-eyed optimism) is that such a depressed market won’t trade much lower in future years since its recent experience has matched America’s in 2008.
Japan is doing exceptionally well, as have our stocks there excluding the massive weakening of the Yen. If the Yen remains this weak, exporters there have an enormous pricing advantage over their foreign competitors and will continue to experience spiking profits. The headlines of the Nikkei hitting a 30-year high could more accurately be rewritten to say it has been flat over 30 years, with quite a runway if the currency doesn’t strengthen, meanwhile U.S. stocks are up 10x in that time. As usual, our positions there are the extreme mean-reversion candidates coming out of down years, now posting improved estimates for the near future.
As a quantitative investor, I admit something that is pure anathema to most investors, which is that I care first and foremost about the factors affecting returns to stocks on average, with company-specific qualities secondary, which is how the academic literature studies stocks. What does that mean? To use one variable as an example of how I consider grouping stocks, companies trading above 10x price to sales, historically and on average, have experienced miserable returns. They’ve performed well in America since 2017, contrary to the historical experience (they also did well in the late 90’s), and reasonable people could argue whether some unicorns have margins and growth so high that simple revenue multiples are now irrelevant, or whether, like the population of past stocks in this group, these favored stocks are also vulnerable. Most people would rightly say every company is unique, and that no investor could decide without a qualitative look into what each is likely to earn in the future (…since we can all do that with precision). I imagine throughout history this has been the argument used by most investors in stocks trading above that multiple, and many of the largest companies now trade above 10x sales or close- Apple, Tesla, Nvidia, Meta, Microsoft, McDonalds, Shopify, Visa, etc; with their wide profit margins, the average FCF/earnings yield is around 3%. Whether their proponents are right or not that these exceptional companies will defy such barbaric valuation multiples despite their past significance, I couldn’t own them due to the historical difficulty of generating profits betting on similarly priced stocks, so I leave it to others to find the rare counterexamples among them.
Intelligent passing investing operates on the premise that assets are efficiently priced, taking advantage of diversification and differences in the timing of returns between regions/asset classes to minimize volatility and achieve satisfactory long-term returns. Given the quality of American companies which has granted the S&P 500 a slight advantage in return over the MSCI EAFE index over the past 50 years, there have still been periods of 20+ years where it has done worse due to differences in valuation and demand. One of passive investing’s primary advantages is that it avoids taking opinions on specific assets and minimizes mistakes that can come from doing so. It also acknowledges that a bet on the American or any other economy would constitute an equal-weighted index, with the support from historical evidence that smaller companies do better on average, and that current winners are often replaced; over most periods until recently, the S&P 500 equal weight dramatically outperforms the value-weighted traditional index, as have the small-mid cap S&P indices. Betting on the biggest firms to dominate and grow indefinitely doesn’t appeal to capitalism’s primary tenet of progress through creative destruction.
Detracting from its primary advantage, passing investing has recently become absolutist, with the belief that American mega-caps will outperform other asset classes due to their quality, and recent experience is used as evidence. Investing in the value-weighted S&P 500, with 14% of the portfolio in Microsoft and Apple, and with 30% in the magnificent seven stocks, is very much an active bet on winners continuing to do well, which flies in the face of passive investing. A smart passive investor wouldn’t use the QQQ’s recent seven-year returns of around 20% per annum (vs around 8% per annum historically) as evidence of anything other than random market movement, and they certainly wouldn’t form opinions based on those moves or assume it is more likely than other indices to continue doing well as a result. 45% of the QQQ’s assets are in its top ten stocks- I’m sure you can guess most of them, and this obviously isn’t passive investing. To the contrary, in periods of extremely and abnormally high value-weighted concentration such as the present, equal-weighted indices tend to do much better. Despite this, maybe the magnificent seven have such a grasp on our economy that current prices are reasonable to pay for them, and investors can profitably exclude all past measures of smart investing (both active and passive). Regardless of expected returns, there’s no telling where prices will go if demand is high enough. The Nikkei 225 rose over ten-fold from 1970-1991, to a peak P/E of around 60 (the S&P 500 would end near that if it doubled without a commensurate doubling of earnings). I’m sure by 1991 the last value investor in Japan had lost all belief and jumped on the bandwagon.
In my opinion, Fama and French contributed to the value-investing discipline as much as anyone, although it took a while. After the seminal thesis on market efficiency in the 1960’s, which anticipated a strong relationship between a stock price’s volatility and future average returns, they published a follow-on study in the 90’s looking at the model’s record since. From the horse’s mouth, the study found no relationship between volatility (beta) and returns but noted the strong relationship of two variables with returns- price to net worth (book) and company size.
The greatest explanation of average returns in stocks came from sorting on those two variables- the smaller the company the better, and the higher the net worth to price the better. They theorized these could be proxies for risk, as most of us would agree that the smallest, most hated or ignored companies are likely riskier on average, and so the proposed relationship between risk and return remained but using different variables.
Much of the research since then has looked at additional quantitative variables (such as leverage, share issuance, sales to price, accruals, cash flow, return on equity/margins, momentum, changes in corporate performance, etc.) with a large body of work supporting the idea that price to net worth and company size comprise the greatest portion of differences in average return. It’s no coincidence that this relationship is strongest in the smallest public companies, and I tend to find that most of our competition for shares comes from individual professional investors, as larger funds can’t invest without moving prices (excluding Japan, which is the one place you can find very low p/b at higher market caps). Below $500m market cap there are no active markets, analysts or passive funds- there is no such thing as a low P/B passive ETF, for example. It’s a defining quality of small, low P/B stocks that if any fund had been involved in the past, they’ve sold off and moved on.
Recently this relationship between P/B and returns is muddier (nearly exclusively in America), with the idea that net worth isn’t relevant nowadays given that many modern firms don’t require tangible assets, which is undoubtedly true. Regardless, few companies can generate 15%+ returns on equity (capital, not levered equity) indefinitely, even among the tech stocks, and if only the special snowflakes are achieving that, then how can an investor do well buying all the others? Purchasing at net worth leads to sub-par returns given the typical company’s measly ROE, so to do well on a 6% ROE firm it’s necessary to buy at a severe discount from equity.
Most companies experience cyclicality, so the 6% average ROE often materializes through some bad years of losses and some great years of gains rather than a consistently low ROE, which is how you get swings in prices. And this is exactly why people are paying 10x+ sales for companies they believe can realize 15%+ constant ROEs long term- for anything with sub-par ROE, which includes half of all stocks, earnings can be inconsistent and you need a discount to book equity, there’s not much debate on that (which is why I find it strange that most low ROE stocks in America trade above book). The debate is that many new public companies will effortlessly generate those 15%+ ROEs.
If many asset-light tech firms can achieve high ROE’s as a result of intangible assets being expensed rather than capitalized, therefore understating book value, as this article proposes, I’d expect to see many high ROE firms among the current high P/B sample in America. But I don’t. Approximately 1,600 stocks out of 6,000 on U.S. exchanges trade above 3x P/B, most of which are bio or tech related, with many recent IPOS. Of those, 500 of them show a 15%+ ROE, leaving 1,100 of them as miscellaneous cash-burners the market is pricing to be highly profitable in the future, over half of which trade above 10x sales. Can investors accurately predict extraordinarily high margins years in advance for these 1,100 profitless firms and price them accordingly now? If these firms are inherently more profitable than older firms because the bulk of their invested intangible assets aren’t listed on the balance sheet, why can’t we see it in accounting profits, and when will they show us and be able to slow down their intangible investment through the income statement, if ever? Will most of these really experience 20%+ ROE’s and eventually triple the number of public companies in America that can do so? The article linked suggests investors frequently identify growth and overpay for it, which is likely the case. I don’t have a strong opinion on most of these expensive stocks, but whether it happens now or five years from now, one of two things will occur for them at these prices: they will eventually generate strong ROEs and prove their merit, or they will get crunched (and as Microsoft showed us from 1999-2016, both can happen at once).
Nobody has concrete answers to these questions as they require speculation, at least until there’s sufficient evidence to disprove historical experience. It’s possible to remain agnostic on these issues while maintaining an evidence-based approach to stick with the value factor in places where it might work best.
As always, feel free to contact me with any questions or comments you have.
Best,
Aaron J. Saunders, Owner & Manager, Comus Investment, LLC.
Editor’s Note: The summary bullets for this article were chosen by Seeking Alpha editors.