Interactive Brokers Group Inc CIO Thomas Frank Sells 39,934 Shar

Thomas Frank, the Chief Information Officer of Interactive Brokers Group Inc (IBKR, Financial), sold 39,934 shares of the company on February 6, 2024, according to a recent SEC filing. The transaction was executed at an average price of $95.52 per share, resulting in a total value of $3,815,305.68.
Interactive Brokers Group Inc, a global brokerage firm, provides trading in forex, metals, stocks, options, futures, and fixed income worldwide. The company services individual investors, hedge funds, proprietary trading groups, financial advisors, and introducing brokers. Interactive Brokers Group Inc is known for its advanced trading technology, comprehensive reporting features, and competitive pricing.
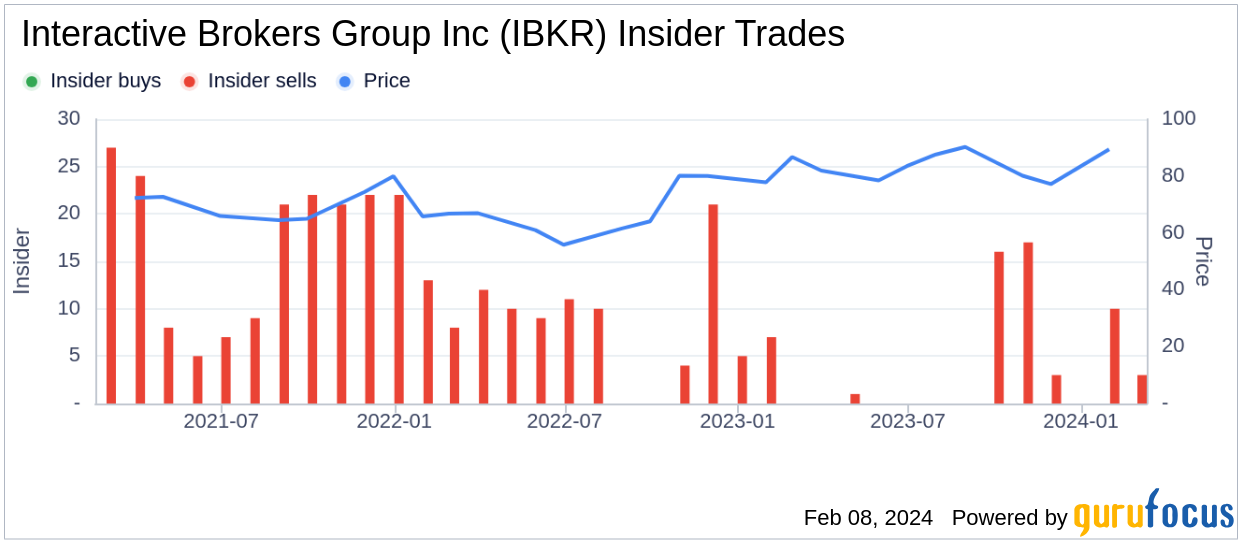
Over the past year, the insider has sold a total of 1,000,000 shares of Interactive Brokers Group Inc and has not made any purchases of the stock. The recent sale further adds to the insider’s sell transactions without any recorded buys in the same period.
The insider transaction history for Interactive Brokers Group Inc shows a pattern of insider selling, with 50 insider sells and no insider buys over the past year.
On the day of the insider’s recent sale, Interactive Brokers Group Inc shares were trading at $95.52, giving the company a market capitalization of $10.106 billion. The stock’s price-earnings ratio stood at 16.69, below both the industry median of 19.225 and the company’s historical median price-earnings ratio.
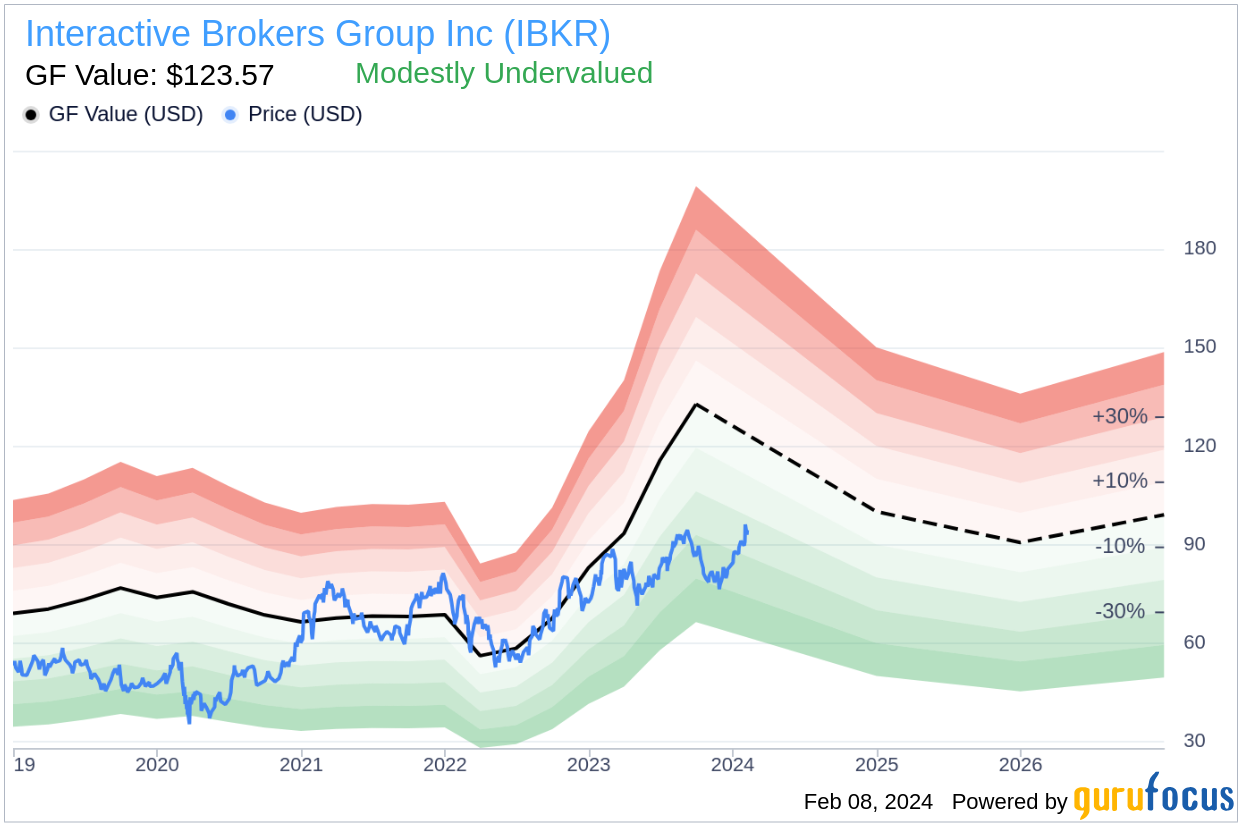
According to the GuruFocus Value chart, Interactive Brokers Group Inc, with a share price of $95.52 and a GuruFocus Value of $123.57, is considered Modestly Undervalued. The price-to-GF-Value ratio is 0.77, suggesting that the stock may be undervalued in relation to its intrinsic value as estimated by GuruFocus.
The GF Value is determined by considering historical trading multiples, a GuruFocus adjustment factor based on past returns and growth, and future business performance estimates provided by Morningstar analysts.

The insider trend image above reflects the recent selling activity by insiders at Interactive Brokers Group Inc.

The GF Value image above provides a visual representation of the stock’s current valuation in relation to its estimated intrinsic value.
This article, generated by GuruFocus, is designed to provide general insights and is not tailored financial advice. Our commentary is rooted in historical data and analyst projections, utilizing an impartial methodology, and is not intended to serve as specific investment guidance. It does not formulate a recommendation to purchase or divest any stock and does not consider individual investment objectives or financial circumstances. Our objective is to deliver long-term, fundamental data-driven analysis. Be aware that our analysis might not incorporate the most recent, price-sensitive company announcements or qualitative information. GuruFocus holds no position in the stocks mentioned herein.


