Fiduciary Management Q4 2023 Investment Strategy Outlook

Daniel Balakov
Investment Strategy Outlook
2023 was a very strong year in global stock markets, with optimism being driven by falling inflation, tight labor markets, and a resilient consumer. Equities screamed higher in the fourth quarter (and particularly so in the U.S.), as the Federal Reserve’s December pivot toward 2024 interest rate cuts reignited investors’ risk appetite. That said, financial conditions have tightened substantially, while global growth has slowed and remains modest. Government deficits are high, debt service costs are on the rise, and global debt levels are hi ng new records – a growing concern. Equity valuations are elevated in the U.S. Large Cap arena where the concentration of the S&P 500 Index is extraordinary, but are more reasonable elsewhere. The FMI portfolios continue to offer investors quality businesses trading at discount valuations, with solid management teams and balance sheets. We strive to deliver strong risk-adjusted returns with a focus on downside protection. When markets are driven by speculative behavior like we are seeing in some segments today, patience and prudence generally pay off.
The 2023 fourth quarter and full-year performance commentary is outlined below:
FMI Small Cap Equity (MUTF:FMIJX)
In the fourth quarter, the FMI Small Cap Strategy increased approximately 12.4% (gross) / 12.2% (net), compared with 14.03% and 15.26% for the Russell 2000 Index and Russell 2000 Value Index, respectively. Relative to the Russell 2000, our top performing sectors included Producer Manufacturing, Consumer Non-Durables, and Electronic Technology, while Retail Trade, Distributi on Services, and Finance weighed. Top individual performers included Skechers U.S.A. Inc.-Cl A, Robert Half Inc., and Simpson Manufacturing Co. Inc., while BJ’s Wholesale Club Holdings Inc., Henry Schein Inc., and Genpact Ltd. underperformed.
For the calendar year, the FMI Small Cap Strategy advanced by approximately 26.3% (gross) / 25.4% (net), significantly outpacing the Russell 2000 and Russell 2000 Value, which gained 16.93% and 14.65% respectively. Our underweight and outperformance in Finance in a year with a regional banking crisis was a notable differentiator. Our housing and construction materials exposure, which we built up in 2022 into weakness, was also additive. Our valuation discipline and business quality focus have been handsomely rewarded.
FMI Large Cap Equity (MUTF:FMIHX)
In the fourth quarter, the FMI Large Cap Strategy advanced approximately 13.1% (gross) / 13.0% (net), compared with 11.69% and 9.50% for the S&P 500 and iShares Russell 1000 Value ETF¹, respectively. Relative to the S&P 500, our sector exposure in Producer Manufacturing, Health Technology, and Retail Trade aided performance, while Technology Services, Electronic Technology, and Industrial Services each failed to keep pace. Masco Corp., Dollar General Corp., and Charles Schwab Corp. outperformed, while CarMax Inc., Schlumberger Ltd., and Carrier Global Corp. each detracted.
For the calendar year, the FMI Large Cap Strategy gained approximately 21.7% (gross) / 21.2% (net), lagging the S&P 500 at 26.29%, but finishing well ahead of the iShares Russell 1000 Value ETF¹ at 11.36%. The S&P 500 has taken on a life of its own, given the incredible concentration at the top and its tilt toward growth stocks (more on this later). Value continues to be out of relative favor versus Growth, with the Russell 1000 Growth outpacing the Russell 1000 Value by over 31% in 2023. While we had a few tough stocks in 2023, the Technology sectors alone accounted for over 100% of FMI’s underperformance versus the S&P 500.
FMI All Cap Equity
In the fourth quarter, the FMI All Cap Strategy gained approximately 11.4% (gross) / 11.2% (net), compared with 12.14% for the iShares Russell 3000 ETF¹. Relative to the iShares Russell 3000, our lack of direct exposure in Energy Minerals was additive, as was our sector exposure in Consumer Non-Durables, and Health Technology. Technology Services, Finance and Distributi on Services each lagged. Skechers U.S.A. Inc. Cl A, Charles Schwab Corp. and Micron Technology Inc. contributed to performance, while Genpact Ltd., Arch Capital Group Ltd., and Arrow Electronics underperformed.
For the calendar year, the FMI All Cap Strategy gained approximately 19.9% (gross) / 19.2% (net), compared with 25.83% for the iShares Russell 3000 ETF¹. Similar to the S&P 500, the iShares Russell 3000 has also participated in the concentration of growthier names with the Technology sectors leading the way.
FMI International Equity (FMIYX)
In the fourth quarter, the FMI International Strategies gained approximately 6.4% (gross) / 6.2% (‘net’) on a currency hedged basis and 9.6% (gross) / 9.4% (‘net’) currency unhedged, compared with increases from the iShares Currency Hedged MSCI EAFE ETF¹, the iShares MSCI EAFE ETF¹, and iShares MSCI EAFE Value ETF¹ gains of 6.01%, 10.71%, and 8.49% respectively. Relative to the iShares MSCI EAFE ETF¹, the International Strategies’ Transportation, Health Technology, and Distribution Services sectors boosted performance, while Producer Manufacturing, Retail Trade, and Industrial Services all lagged. SAP SE, Samsung Electronics Co. Ltd. Pfd., and Ryanair Holdings PLC ADR were among the top individual stocks, while Unilever PLC, B&M European Value Retail S.A., and Roche Holdings AG each weighed. A weak USD was a headwind for the currency hedged portfolio.
For the calendar year, the FMI International Strategies advanced by approximately 23.2% (gross) / 22.3% (‘net’) on a currency hedged basis and 23.6% (gross) / 22.9% (‘net’) currency unhedged, outperforming the iShares Currency Hedged MSCI EAFE ETF¹, iShares MSCI EAFE ETF¹, and the iShares MSCI EAFE Value ETF¹ returns of 20.33%, 18.40%, and 18.89% respectively. Comparing calendar year returns, the currency hedge was immaterial over the course of the year. The portfolios’ housing, construction materials, travel, technology, and UK consumer holdings all helped drive performance. We leaned into each of these exposures when they declined in 2022, taking advantage of what appeared to be temporary dislocations within these segments.
Concentration Game: Memory Loss
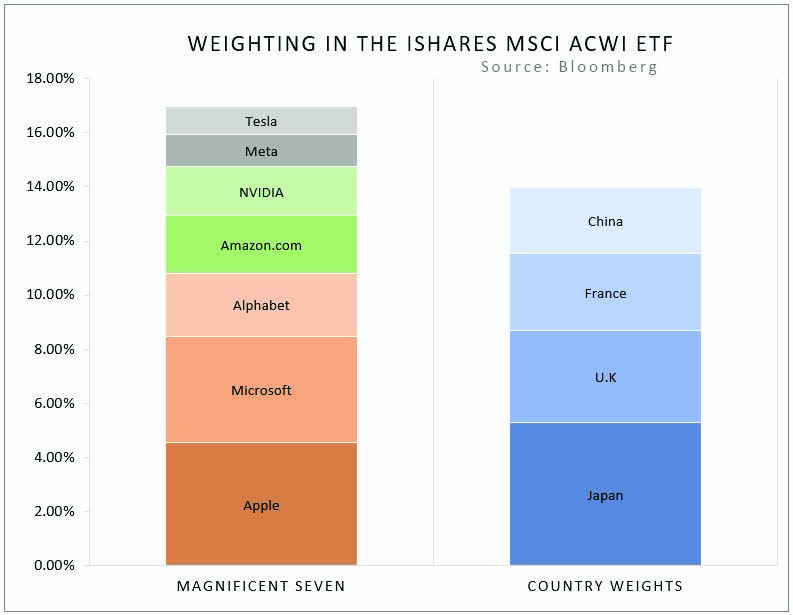
Many investors put little thought into their ownership of the S&P 500. It is largely viewed as a “safe, diversified” investment; a blind faith that we think could prove costly. The S&P 500 concentration has ballooned to remarkable levels, with the Magnificent Seven (Apple, Microsoft, Alphabet, Amazon, Nvidia, Tesla, and Meta Platforms) at the epicenter, representing ~28% of the S&P 500’s market value. In 2023, these seven companies generated an average stock market return of 111%, while the median S&P 500 company was up ~10%. In aggregate, they accounted for 62% of the S&P 500’s total return this year. The Wall Street Journal (WSJ) made an eye-opening observation: “The influence of the big tech stocks is massive on a global scale. Within the MSCI All Country World Index—a benchmark that claims to cover about 85% of the global investible equity market—the combined weighting of the Magnificent Seven is larger than that of all of the stocks from Japan, France, China and the U.K.” Below we illustrate this using the iShares MSCI ACWI ETF as a proxy.
While the earnings growth of the Magnificent Seven has been superior, future expectations and valuations are also high. In 2024, the Magnificent Seven is expected to grow at over twice the rate of the remaining companies, and they currently trade at an 83% premium2. In a recent investor survey, 77% of respondents said they expect the Magnificent Seven to outperform the 493 once again in 2024. The S&P 500 depends very heavily on the performance of a few, huge companies. What happens if economic growth slows and these companies do not meet lofty expectations? What if equity valuations, which are currently in the 10th decile of historical valuation (one of the most expensive stock markets in U.S. history), come under pressure?3
Importantly, the speculative excess has not been limited to the Magnificent Seven. The Nasdaq (a proxy for the technology sector) was up ~45% in 2023, adding around $8.4 trillion in market cap. According to Goldman Sachs, some of the top performing themes in the U.S. this year included: Bitcoin Sensitive Equities (+258%), Memes (+117%), Artificial Intelligence (+93%), Megacap Tech (+77%), New Technology (+71%), Secular Growth (+51%), Expensive Software (+50%), and Non-Profitable Tech (+52%). Meanwhile, FMI’s bread and butter, Quality Compounders, were up only 8%. We do not believe this dichotomy is sustainable.
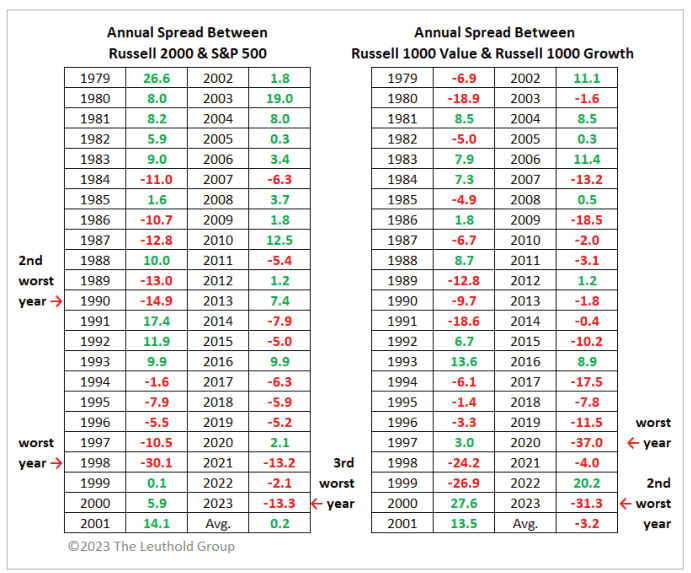
Much of the speculative behavior is taking place in U.S. Large Cap growth stocks. As illustrated, since 1979, 2023 was the second worst year on record for the spread between the Russell 1000 Value and Russell 1000 Growth, and the third worst year in history for the S&P 500 versus the Russell 2000 (U.S. Small Cap stocks).
Over the last 15 years, the picture looks similar, as the S&P 500 has outright dominated, with cumulative returns of the Russell 2000 and MSCI EAFE Indices lagging the S&P 500 by over 225% and 437%, respectively. During that time, U.S. nominal GDP grew 4.3%, S&P 500 earnings grew 6.9%, and the S&P 500 generated a ~14.0% compound annual return (~40% higher than the long-term historical average of ~10%). It is notable that the S&P 500’s return was over 2 times the rate of underlying earnings growth, and 3 times nominal economic growth. Prospective returns are likely to be closer aligned to the underlying growth of corporate earnings and the economy versus recent history. Breaking down the components of the 15-year S&P 500 return, ~50% came from earnings growth (6.9% annually), ~16% from the dividend yield (2.2%), and ~34% from multiple expansion (4.7%). Given that valuations are near all-time highs, there could be downside risks to valuation multiples if there is any reversion to the mean (i.e. negative returns from this important component).
Additionally, profitable U.S. Small Cap stocks and International stocks are currently trading near all-time high discounts to their U.S. Large Cap counterparts. Future outperformance by the S&P 500 may be much tougher to come by from today’s elevated starting point.
Lastly, valuations do not seem to reflect the economic risks that are lurking on the horizon. There appears to be a universally held opinion that we are headed for a soft landing, and that global central banks can delicately manage right through the current cycle without rocking the boat. We would remind investors that over the last 100+ years, stock markets were littered with economic surprises – events that no one expected. Dislocations and externalities are the norm, not the exception, and these may not be fully appreciated today with valuations at the high end of their historical range. Despite a litany of potential macro and geopolitical risks, we have built portfolios to survive the unexpected. At FMI, we strive to own all-weather vehicles that can thrive over a full cycle and in virtually any economic backdrop, with valuations that embed a significant margin of safety for when things don’t go as planned. For the team, nothing is more important than avoiding the permanent impairment of capital.
Debt: Still A Dirty Word
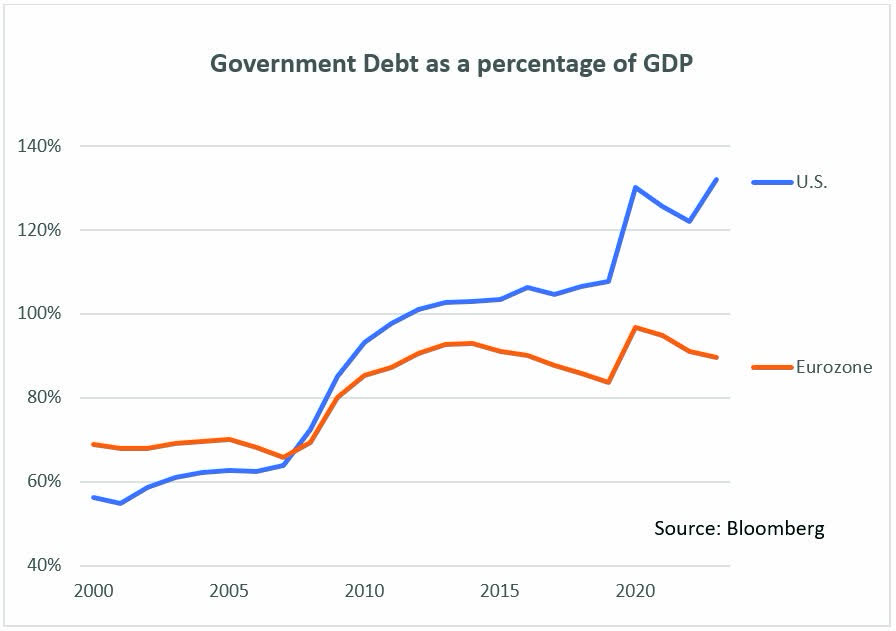
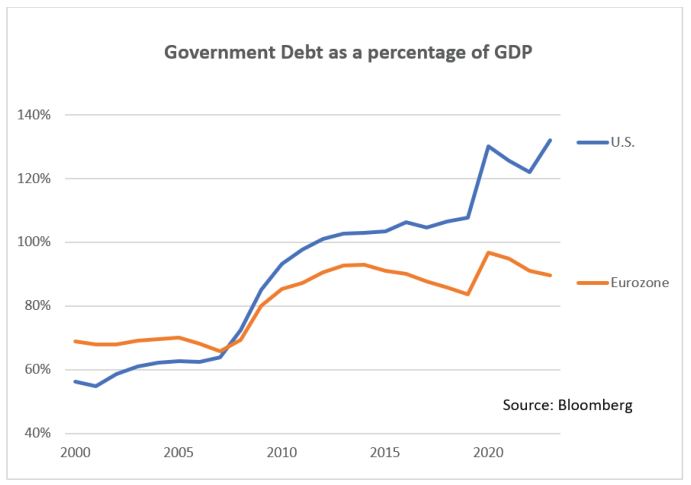
Among the list of potential factors that could cause a dislocation in global stock markets, a debt-related crisis would be near the top. According to the Institute of International Finance (IIF), global debt rose by $10 trillion in the first half of 2023, reaching a new record of $307 trillion, over 3.3 times global GDP! Higher debt levels and interest rates are pushing up government interest expenses, which topped $2 trillion globally in 2023 (up 10% from 2022), according to the International Monetary Fund (IMF). As reported by the WSJ, interest expenses could exceed $3 trillion by 2027. The U.S. is one of the worst offenders, with a budget deficit of $1.7 trillion in 2023 (6.3% of GDP vs. 5.4% in 2022), and the highest interest expense to GDP (2.45%) since 1998. Interest expenses in the U.S. could double by 2025 once the existing debt matures and gets refinanced. The IMF expects the U.S. deficits to reach 7.4% in 2024 and 2025. Europe, conversely, which a decade ago was immersed in the European sovereign debt crisis, is finally getting its house in order. Eurozone government deficits are expected to fall to 3.4% of GDP in 2023 and 2.7% in 2024 (from 3.6% last year). China and Japan remain highly indebted (as discussed in prior shareholder letters), which continues to be a concern.
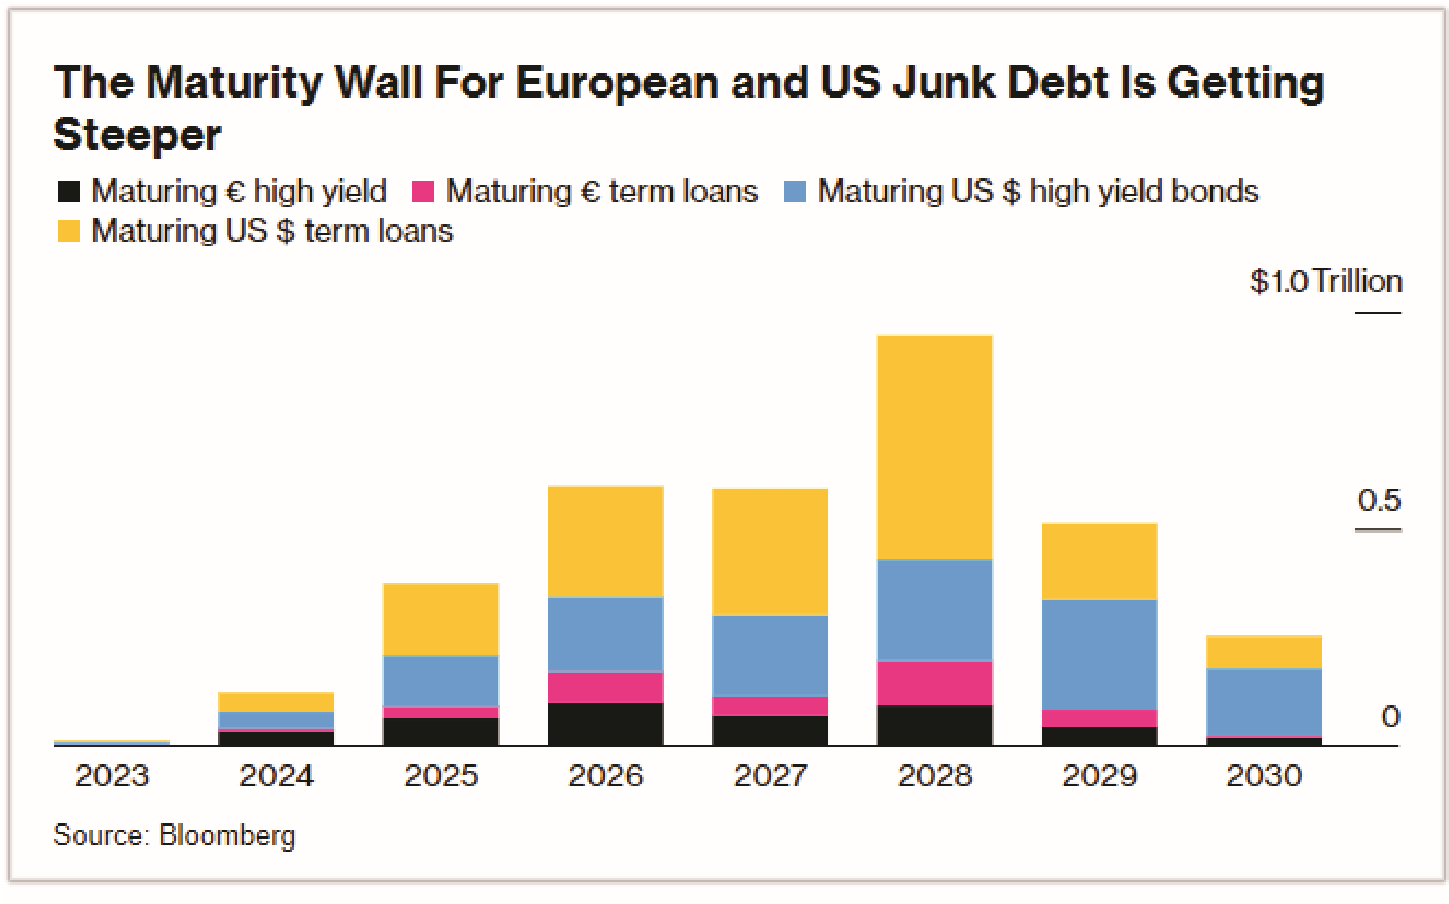
Corporate balance sheets are also worth watching closely. With ground-hugging interest rates for most of the last decade, companies took on increased debt, levels that will become much harder to service when refinancing comes due at significantly higher rates. As Bloomberg illustrates above, the debt maturity wall for European and U.S. Junk debt is fast approaching, with $2.5 trillion of high yield bonds and leveraged loans coming due between 2025 and 2028. Interest rates may double or triple overnight for some of these companies. This will undoubtedly be a headwind for corporate earnings growth in the coming years.
Finally, personal balance sheets in the U.S. are not as robust as they once were. According to the Federal Reserve Bank of San Francisco, excess savings in the U.S. has fallen below $500 billion, from $1 trillion a year ago, and over $2 trillion two years ago (following record stimulus handouts). While the consumer has been spending, U.S. credit card balances have reached a record high of $1.08 trillion. Delinquencies are the worst they have been in 12 years and interest rates on credit cards now exceed 21% (another record high). Conversely, household debt as a percentage of GDP in the European Union has been falling over the last couple years, while excess savings has recently been on the rise. Only time will tell how these respective economies and stock markets will start to reflect these diverging realities.
While elevated valuations and risk make it tougher to find attractive investments, the team has worked hard to build and maintain a portfolio of solid candidates. Listed below are several stocks we find appealing:
BJ’s Wholesale Club Holdings Inc. (BJ) – Small Cap/All Cap
BJ’s is the third largest warehouse club operator in the U.S., with locations primarily along the East Coast. The warehouse club business model has many attractive characteristics, offering a limited number of items in each product category (sold in large pack sizes) which allows them to drive down purchasing costs. These companies have low operating costs, efficient distribution networks, and are typically located in low-cost areas. Their no-frills stores, simple operations, and large real estate footprints create labor efficiencies. This allows for merchandise to be offered at very sharp prices. Customers gain access to these low prices by purchasing annual memberships to the clubs, which have high retention rates and generate steady, recurring revenue. The business earns high returns on capital despite low prices and operating margins. BJ’s has a checkered history but has made significant improvements to the business over the past decade. The market remains skeptical as to how sustainable these improvements are and how well they can compete against strong peers in the warehouse club industry. We believe this misses the mark, as the club industry commands a small share of a vast retail market. We believe all of the warehouse club operators can grow and take share from indirect competitors that can’t match their pricing. If this proves out, we believe BJ’s valuation multiple should re-rate higher to better reflect the underlying strength of its business model.
Carrier Global Corp. (CARR) – Large Cap/All Cap
As part of United Technologies, we believe Carrier suffered from undermanagement. Despite that, the business still grew consistently in the low single digits and was nicely profitable due to an oligopolistic industry and Carrier’s strong competitive position. However, the cost structure was not optimized and they were not investing in long term growth. Now that Carrier has over three years as a standalone company, we believe the company’s operations are increasingly on its front foot. CEO Dave Gitlin, who came from United Technologies’ crown jewel aerospace business, has been instrumental in these efforts. On top of that, through a series of ongoing divestitures and the acquisition of a European heat pump manufacturer, Carrier is well on its way to becoming a pureplay heating, ventilation, and air conditioning business with higher returns on capital and faster organic growth. After rerating significantly coming out of COVID, Carrier’s shares lost momentum due to perceptions of choppy execution, COVID normalization, and future recessionary fears. Although these risks may come to pass, a modest starting valuation and good industry structure gave us confidence that our downside was relatively protected. If Carrier can execute on growth, costs, and the portfolio transformation, we believe there is significant upside.
Diageo PLC (DEO) – International
Diageo is the #1 player in the large and attractive global spirits industry, with #1 positions in Scotch, Tequila, Gin, Vodka, and Rum. Total Beverage Alcohol (TBA) is a $950+ billion market, with Diageo at 4.7% of TBA, and aspiring to 6% by 2030. Premiumization in spirits is value creating, and Diageo owns 9 of the top 30 global brands, including Johnnie Walker, Tanqueray, Smirnoff, and Guinness. 12 of Diageo’s top brands are over 140 years old. The company has strong exposure to growth in emerging markets (38% of sales) and has proven to be a superior brand builder. The Diageo portfolio has been optimized, with limited reliance on M&A over the last decade. Capital allocation has been shareholder friendly. Following a period of post-COVID inventory destocking, Diageo trades at its lowest valuation in 10 years.
Consistent with our succession plan, we are pleased to announce that Jonathan Bloom has been elevated to CIO. Concurrently, Pat English will drop the Co-CIO title and remain Executive Chairman, where he’ll maintain an active role on the research team. Investment decisions will continue to be discussed and implemented by our portfolio management committee, which Pat will remain a part of until his retirement at the end of 2025.
Thank you for your continued support of Fiduciary Management, Inc.