My 9% Income Portfolio–Harmony In Investment

Castle of Brolio, Chianti, Tuscany. Uwe Moser/iStock Editorial via Getty Images
Chianti and the Harmony of Landscape
Along the Via Chiantigiana, which connects Florence to Siena, the landscape and architectural universe of the Florentine countryside unfolds, marked by the grim legacies of a never-forgotten Middle Ages and ripe fruits of a Renaissance still fertile with cultural stimuli. Indeed, it is precisely in Chianti that the humanistic, all-Florentine concept of nature shaped to the measure of man takes substance. The stately villa then becomes a place of contemplation that opens outward, modifying the relationship with the surrounding landscape, which constitutes a new and fundamental center of gravity.
Last week I went to Radda in Chianti, near Siena, and from there to the castle of Brolio, defended for centuries by the Ricasoli, one of the most illustrious names in Florentine heraldry, as a Florentine outpost against Sienese aims. What makes this corner of Tuscany unique is that sublime interweaving of sinuous olive slopes and rugged wooded reliefs, of menacing castles and airy patrician residences, of massive stone farmhouses and slender clumps of cypresses, whose presence punctuates the evolution of a landscape “combed” by the vineyards that produce the extraordinary wine of the same name.
Harmony in Investment
Chianti is a microcosm of miraculous balance between natural environment and human presence, the result of a harmony that is not easy to achieve in today’s world. Yet I believe that some harmony can and should be sought in investment as well. For example, by creating a long-term portfolio whose securities balance the need to provide a steady cash flow over time while allowing the value of the initially invested nominal capital to increase over the years.
Someone said that “dividends are like the harmonious chords that contribute to your portfolio’s sound.” Through sound is expressed the art of music, which is a tuneful sound. To my ears, dividends and capital gains create music, dividends and capital losses generate dissonance. And for the portfolio as a whole to produce music, I am increasingly convinced that the track record of each security, if not since launch, then at least over the past 5 or 10 years, is of paramount importance.
No one can guarantee me that stocks that have grown in value to date will continue to do so in the future, but if it is true that investing means laying out cash now to get more cashback later on, the question is: how much cash am I going to get in the future, and, most of all, how sure am I to get it if I invest in stocks that have been steadily declining since the moment they were launched in the market?
Bonus-Malus
I’m here for one reason and one reason alone. I’m here to guess what the music might do a week, a month, a year from now. That’s it. Nothing more.” (Jeremy Irons from the movie “Margin Call”)
A niece of mine studied financial mathematics, deciding along the way to specialize in actuarial mathematics, that branch that considers transactions pertaining to events that are uncertain in their occurrence or for which it is uncertain when they may occur. Thus, the actuary evaluates quantitative economic phenomena characterized by uncertainty. That is, he or she studies probable events and measures their intensity and frequency on the basis of statistical findings, such as for calculating rates for automobile liability and insurance based on the probability that a certain risk will come true.
For example, the Bonus-Malus system determines the premium the insured must pay to their company based on their merit class: it is a mechanism whereby virtuous drivers pay less, while those who cause accidents pay more. I am 64 years old and I am in my insurer’s best merit class because I am in an age group with low accident risk from a statistical point of view and because I have not had an accident in the last 5 years. My insurer then calculates the annual premium to be paid based on general statistics and my insurance history, without, of course, having any certainty that things may not change in the future.
Now, I am about as far from an actuarial mathematician as one can imagine, having majored in Slavic languages, yet I wonder what is logically wrong with applying the bonus-malus method to the selection of financial securities based on a positive historical trend. In this case, both the evolution of the specific investment sector (general statistics) and the specific management skills of its managers (personal history) are reflected.
By this I do not, of course, believe that an evaluation criterion based on historical trend can allow me to guess what the music might do a week, a month, a year from now, as Jeremy Irons says, but I believe, from the point of view of maintaining purchasing power over time, that it can make more sense to bet on securities with a positive trend than ones constantly losing. This approach also provides me with a positive mental anchor. That is, it establishes what I believe is a favorable association between the experience provided by the mathematical data and my state of mind as an investor trying to reduce the margins of error by being clear first and foremost about what to avoid.
My Purchase Criterion
If I were to construct my portfolio today, I would base it on a selection of stocks that have proven to generate value over time in spite of the crises experienced by the markets since 2020, as I described in some previous articles (“38 CEFs Worth Exploring” and “BDCs For An Income Portfolio“). Unfortunately, I arrived at these conclusions in the aftermath of the creation of my portfolio, the foundations of which were laid by me in the fall of 2019. This led to a choice of securities that upon testing of the facts did not all turn out to perform as I had been led to believe based on their previous performance and my selection criteria at the time.
In fact, my portfolio today has a certain number of CEFs and ETFs that are suffering from the point of view of NAV performance, although over time I have shaped it by increasing purchases on the securities with the best track record and leaving behind those with the worst track record.
So, I have an overall investment picture at least in the beginning based proportionally on the performance of their NAVs (whether positive or negative). A numerical, objective criterion, which I then supplemented with other, more subjective types of assessment, such as the age of the securities, the investment sector, the quality of the dividend (ratio of income, capital gains and/or eventual return of capital), the market cycle or the reputation of the management (which led me, for example, to weigh some PIMCO funds against the performance of their NAVs).
A bias to which I have never been subjected to is that of becoming attached to securities merely because I bought them, just as I believe I am fairly unscathed by the sunk cost fallacy, i.e., that mental mechanism that is triggered when faced with a cost that is now sunk. Indeed, loss aversion induces one to persist in trying to recover it, in whole or in part, instead of admitting the error and closing the mental balance sheet at a loss. As for me, losing money obviously does not amuse me, but I accept it as an inevitable “business cost.”
Finally, I have no interest in, nor envy of, investors who achieve higher returns than I do, as I often read about, even here in SA. I know my limits and am content with what I have without any desire to venture down paths unexplored for me, which might only increase my stress level in times of lurching markets. Also for this reason, given that no one can ever know what can happen in the markets, trying to predict the outcome of stocks that are constantly spinning on themselves seems to me to be a decidedly unproductive effort.
Snapshot of My Portfolio
As you may know, my investments today include 28 securities (19 CEFs, 5 ETFs, 3 BDCs, 1 ETN) divided into three different portfolios:
Cupolone Income Portfolio (named after Brunelleschi’s Florentine dome) consists of seventeen CEFs with monthly distributions:
- BlackRock Science And Technology Trust (BST)
- Calamos Dynamic Convertible and Income (CCD)
- Calamos Global Total Return (CGO)
- Eaton Vance Enhanced Equity Income II (EOS)
- Eaton Vance Tax-Advantaged Global Dividend Opportunities (ETO)
- Eaton Vance Tax-Advantaged Dividend Income (EVT)
- Guggenheim Strategic Opportunities (GOF)
- John Hancock Tax-Advantaged Dividend Income (HTD)
- PIMCO Corporate & Income Strategy (PCN)
- PIMCO Dynamic Income (PDI)
- John Hancock Premium Dividend (PDT)
- PIMCO Corporate and Income Opportunity (PTY)
- Cohen & Steers Quality Income Realty (RQI)
- Special Opportunities Fund (SPE)
- Cohen & Steers Infrastructure (UTF)
- Reaves Utility Income Trust (UTG)
- XAI Octagon Floating Rate & Alternative Income Trust (XFLT)
Giotto Income Portfolio (named after the fourteenth-century Florentine painter and architect) includes five ETFs and one ETN with monthly distributions that adopt a covered-call strategy:
- JPMorgan Equity Premium Income (JEPI)
- JPMorgan Nasdaq Equity Premium Income (JEPQ)
- Global X Nasdaq 100 Covered Call (QYLD)
- Global X Russell 2000 Covered Call (RYLD)
- Credit Suisse X-Links Crude Oil Shares Covered Call ETNs (USOI)
- Global X S&P 500 Covered Call (XYLD)
Masaccio Income Portfolio (named after the founder of Renaissance painting) contains three BDCs and two CEFs with quarterly distributions:
- Ares Capital (ARCC)
- Crescent Capital (CCAP)
- Fidus Investment (FDUS)
- Barings Corporate Investors (MCI)
- Royce Value Trust (RVT)
As I mentioned, within my portfolio each security has a different weight, highlighted in the following summary table, sorted according to the amount of money invested at the time of purchase and not the current market value. NAV performance (or price performance, in the case of ARCC, CCAP, and FDUS), on the other hand, is shown from the time of launch and is updated to the current situation. Fidus Investment and Barings Corporate Investors are the last positions I opened last fall.
Weight and Nav (Author, YCharts)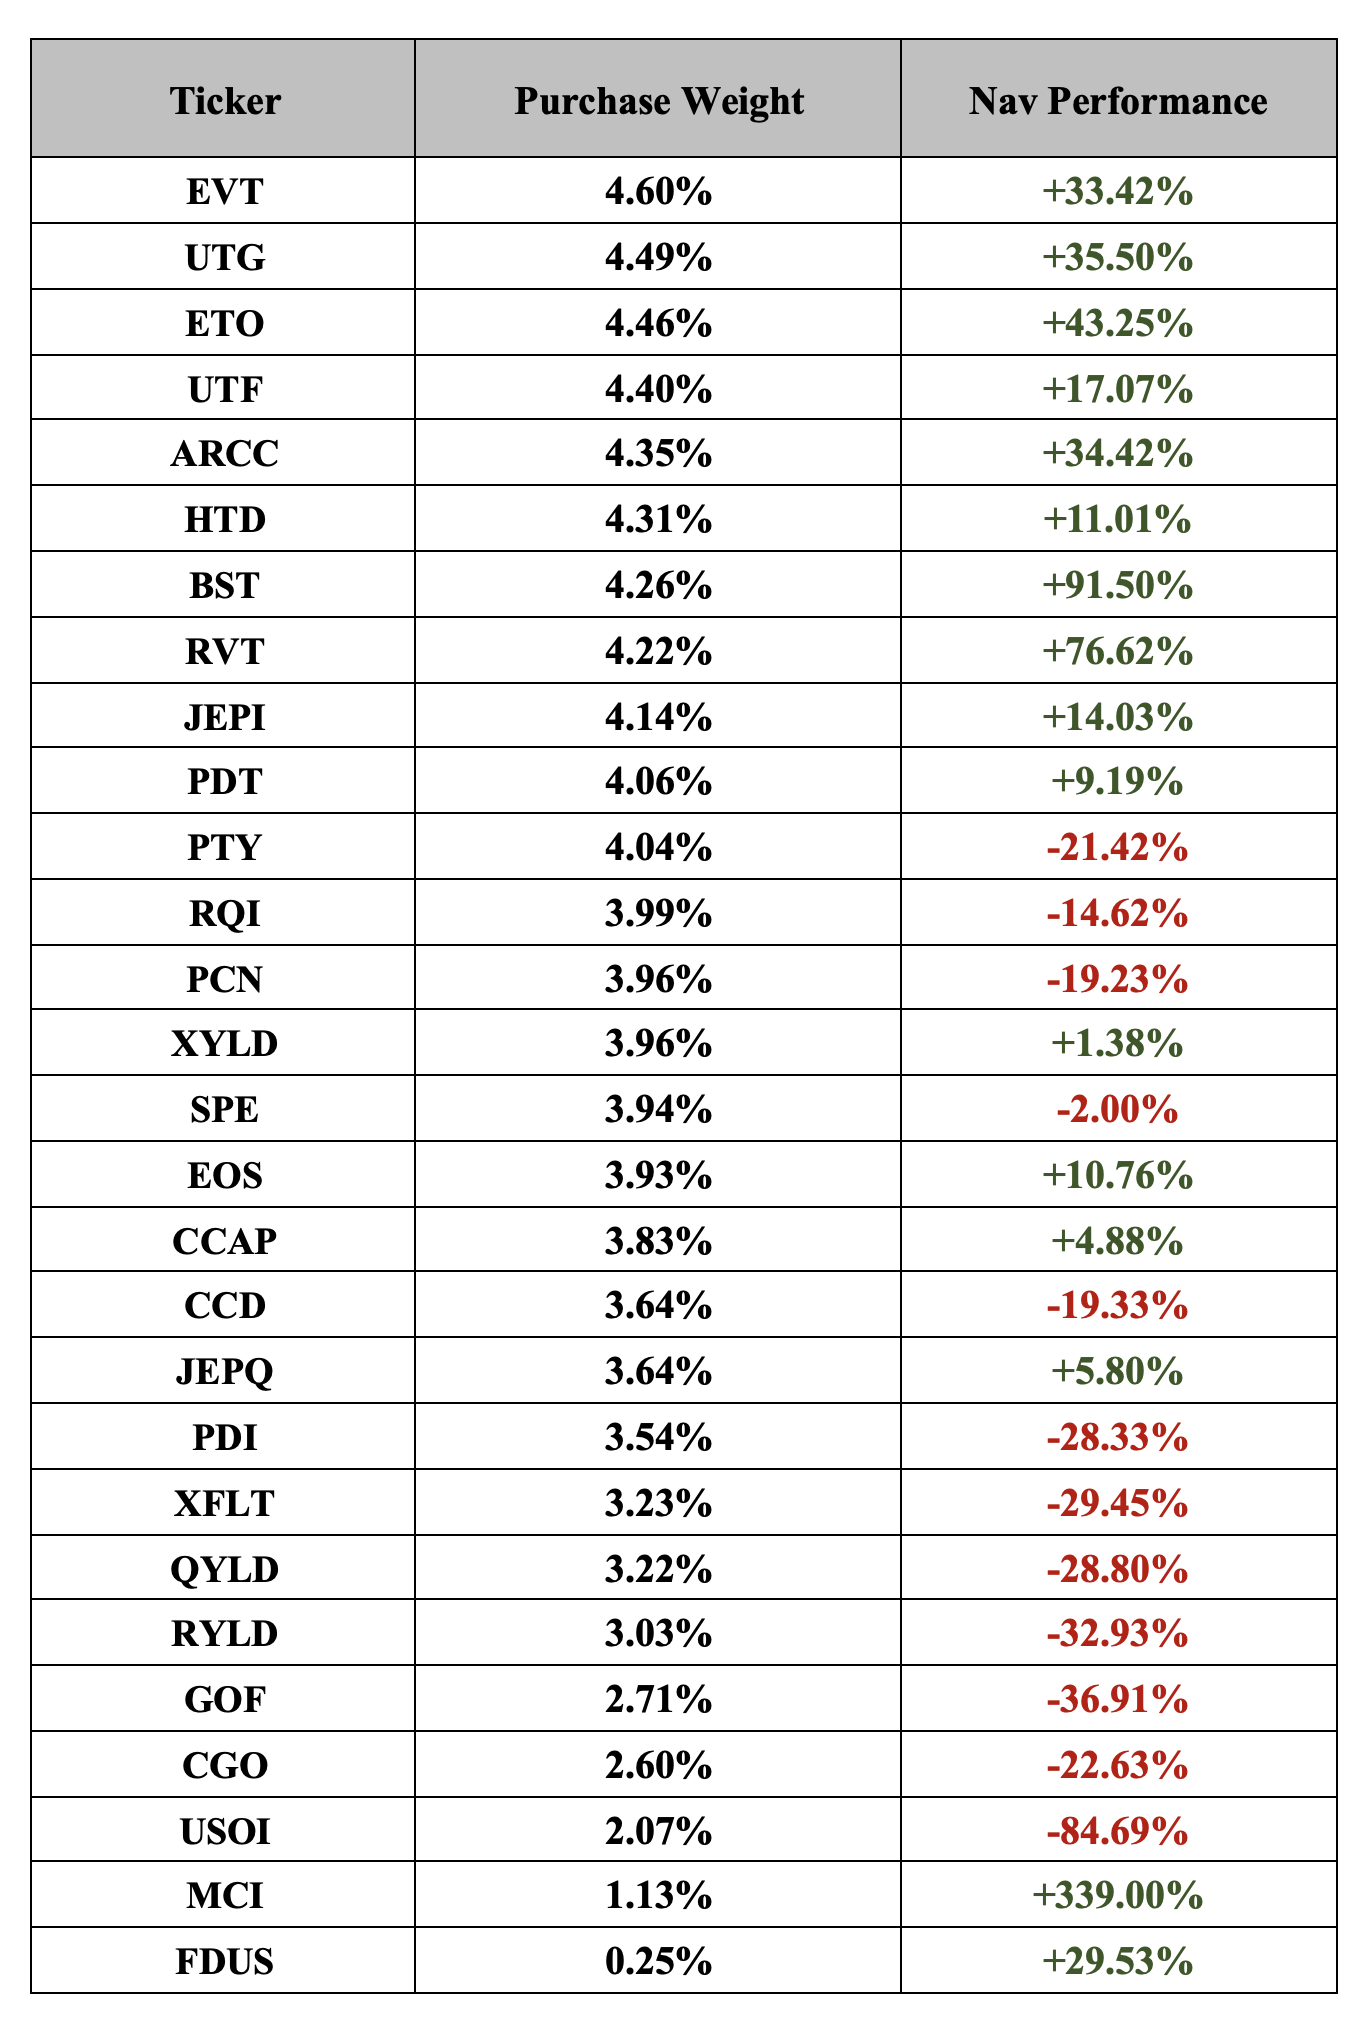
Note: USOI’s loss since launch exceeds 84%. Its descent has slowed down a lot over the past four years, which prompted me to include a small amount in my portfolio because of its peculiar dividend feature for me as an Italian. In fact, it is the only stock in my portfolio that can offset my past losses: let’s say its coupon is “tax free” for me.
It should be kept in mind that the NAV performance of each security at the time of purchase was different from what we see today, which in some cases led to choices that later turned out to be suboptimal. Buying a stock is like getting on a runaway train: from that moment on, one can benefit from its positive performance as well as suffer from its decline. One and the other can be temporary, although some of my securities in the last two years have suffered much more than I would have imagined at the time of purchase. What I was interested in illustrating, however, is the criterion I followed in constructing my portfolio, regardless of its current performance.
From now on, if I rely on this criterion and eliminate from my horizon all securities that do not have the desired characteristics, I can focus my analysis only on those that meet its requirements, so that I can later be better able to manage my emotions in the face of market ups and downs. The only things I can have control over in the financial markets are the selection of securities and my reactions to their behavior. “Know thyself” was written in large letters on the pediment of the temple of Apollo at Delphi in ancient Greece: an invitation to investigate within oneself, to discover that the essence of our life is within us, not outside. Even in investments.
Price Behavior since 2020
The following graphs show the market price performance of my securities as of January 2, 2020, listed according to their performance relative to the price at which I purchased them. Since my portfolio was created starting from spring 2020, I decided to analyze them from the beginning of that year, just before the outbreak of the pandemic. A short-term view, but one that reflects all the changes in scenario (and there have been quite a few) that have occurred over the past four years.
The red line indicates my purchase price and allows immediate comparison with the changes, positive or negative, to which the price of each security has been subjected from January 2020 to the present. Please note that CCAP was launched on February 7, 2020 and JEPQ on May 6, 2022.
Thirteen stocks are in positive territory compared to my purchase price, with percentages ranging from +25.8 percent marked by ETO, a global equity fund that trades at a 10 percent discount to NAV, to a few tenths above par marked by HTD, a fund focused on common equities, particularly utility stocks. Of interest is the gain of a couple of percentage points marked by PTY multi-sector bond fund, whose price is supported by a premium to NAV exceeding 28 percent despite the NAV itself registering a loss of more than 21 percent since launch. A premium that is undoubtedly attributable to the reputation its management has historically enjoyed, and which is also reflected in the other two PIMCO CEFs in my portfolio, PCN (premium +18%) and PDI (premium +11%). A kind of Bonus-Malus applied to CEFs.
Eaton Vance Tax-Adv. Global Dividend Opps
Price Performance (Morningstar, Author)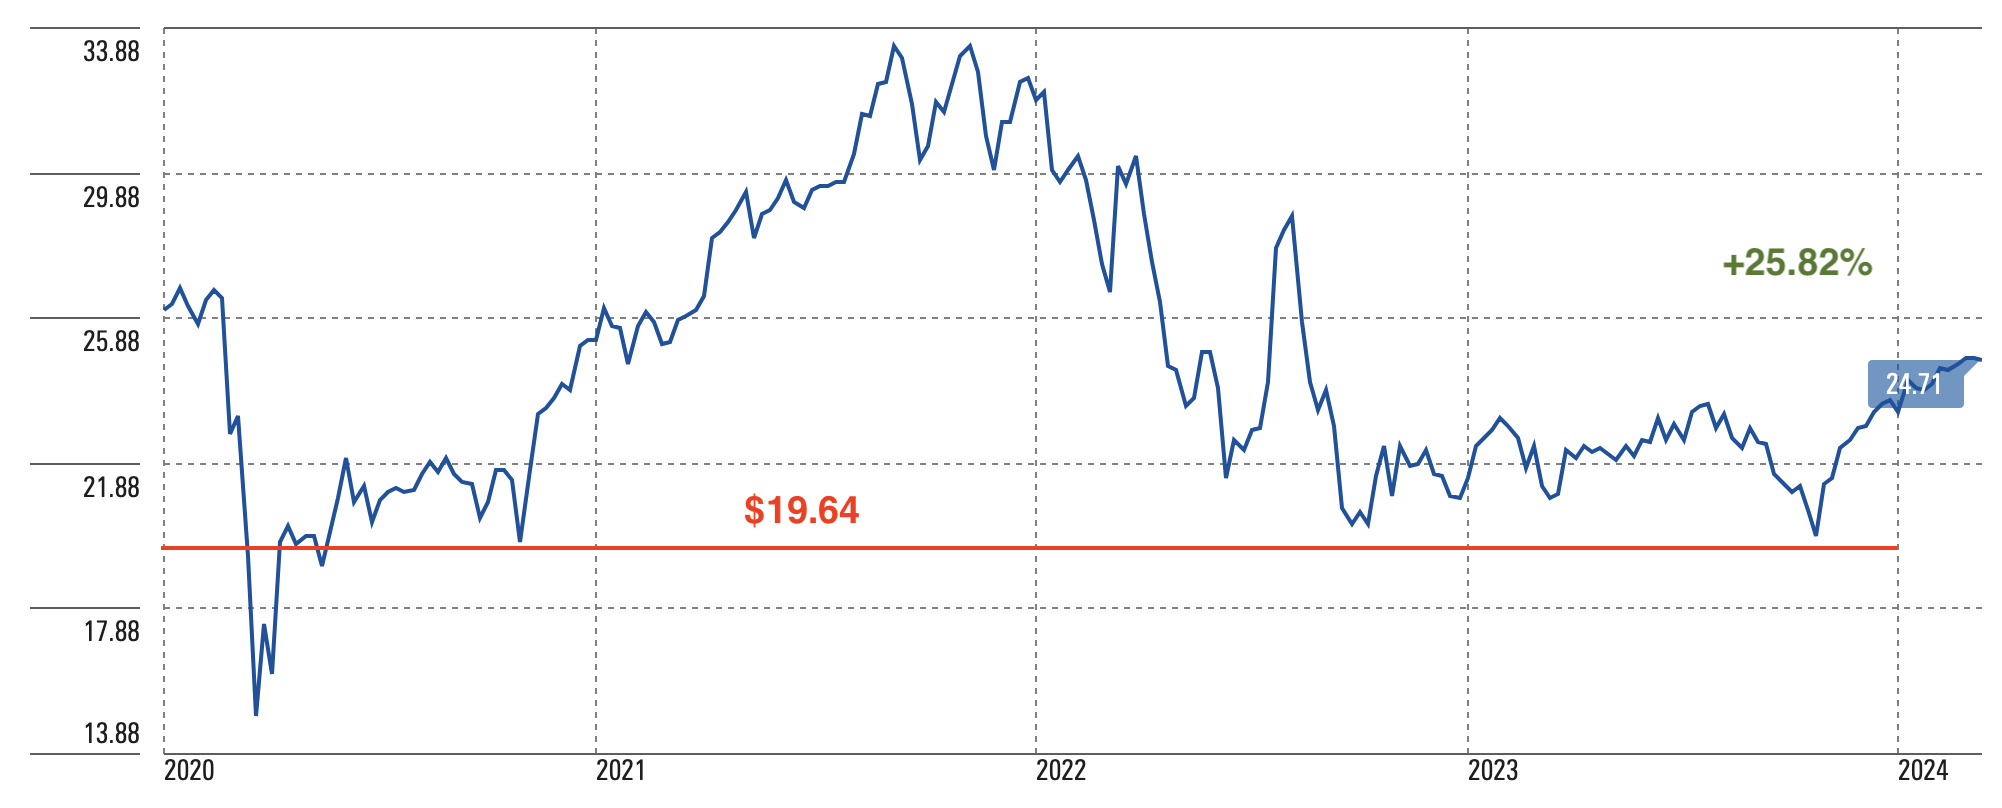
JPMorgan Nasdaq Equity Premium Income
Price Performance (Morningstar, Author)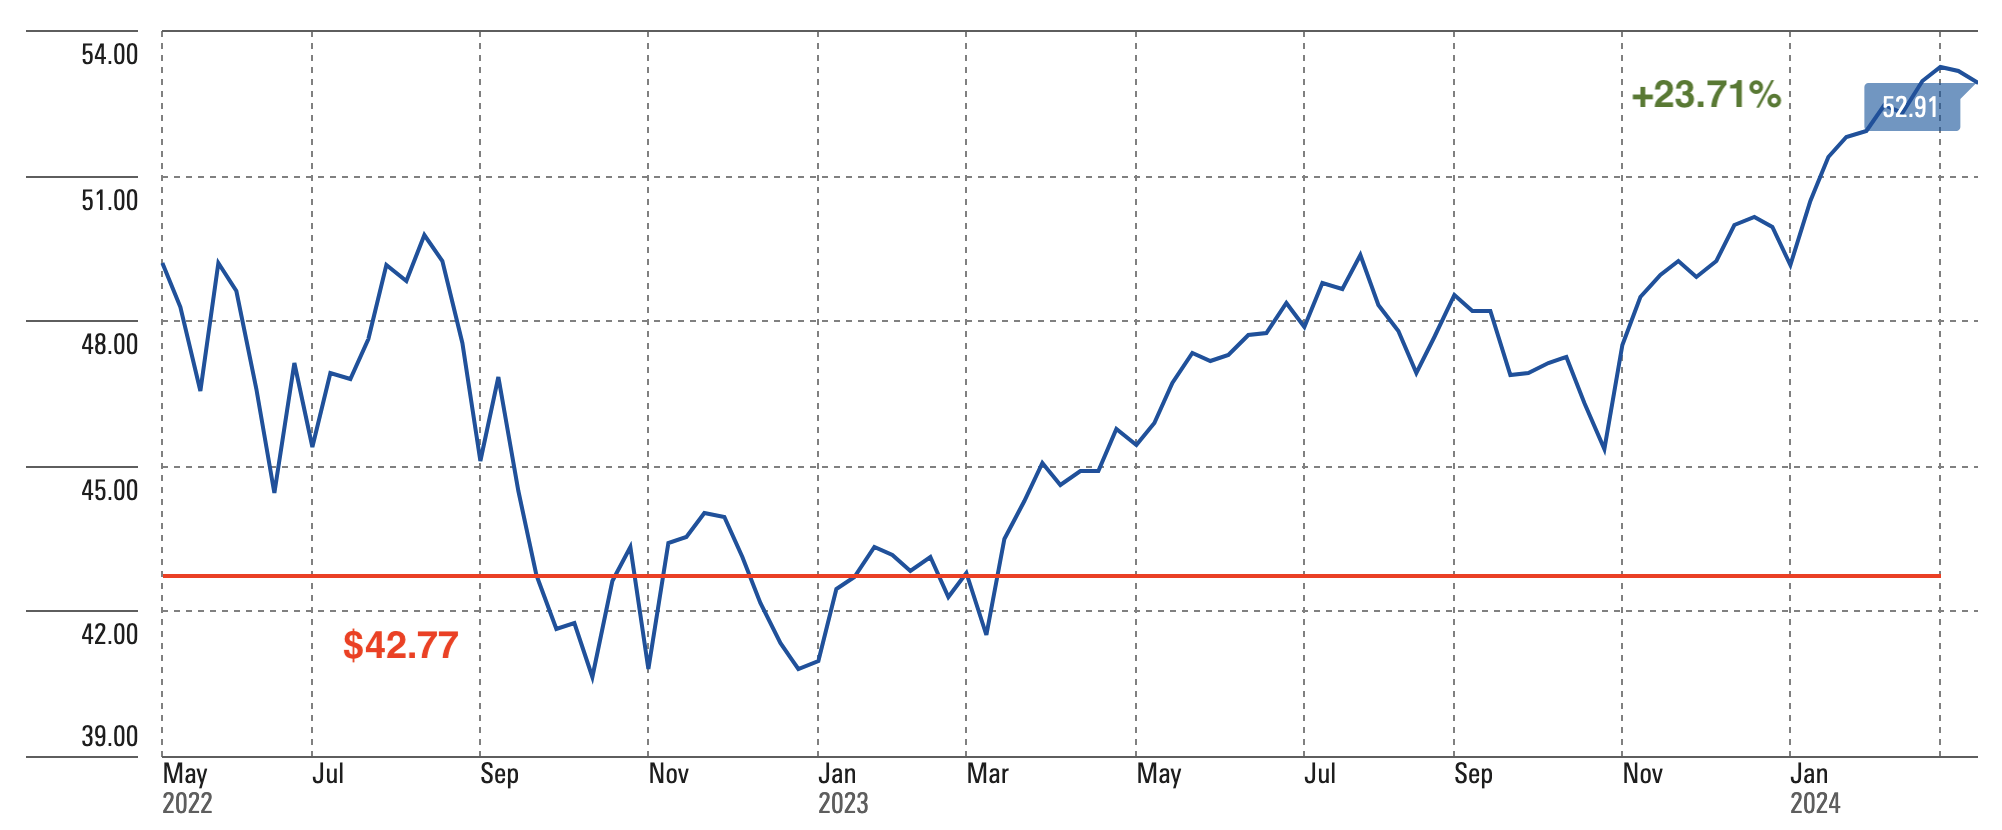
Crescent Capital
Price Performance (Morningstar, Author)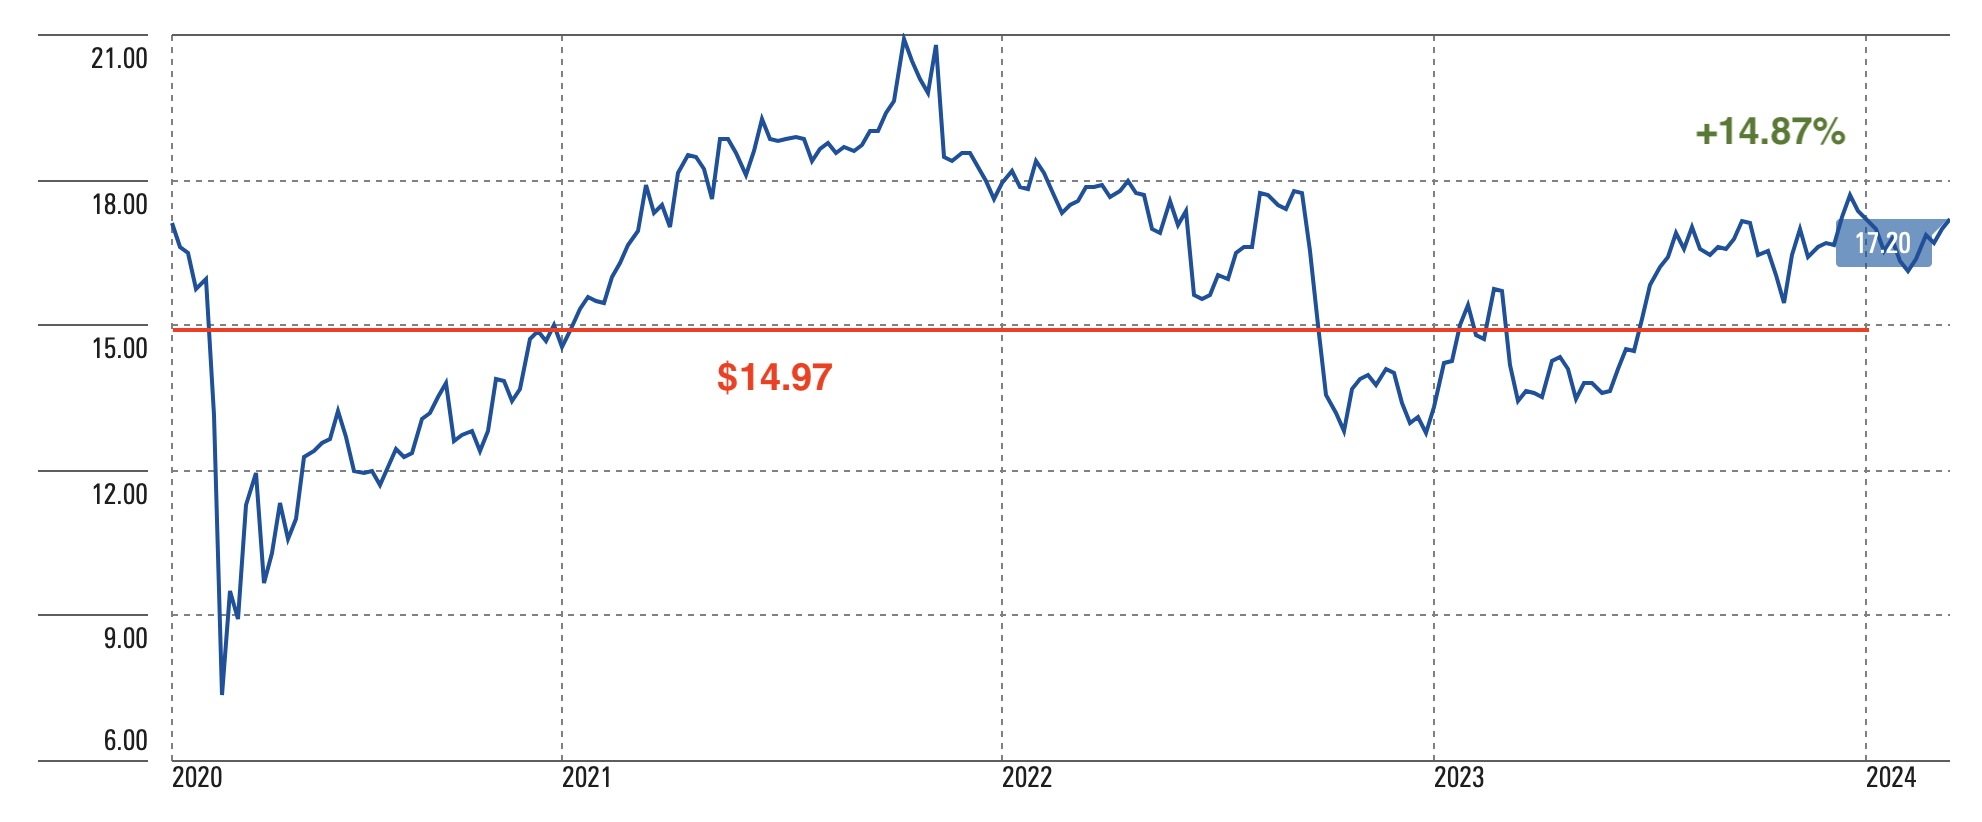
Barings Corporate Investors
Price Performance (Morningstar, Author)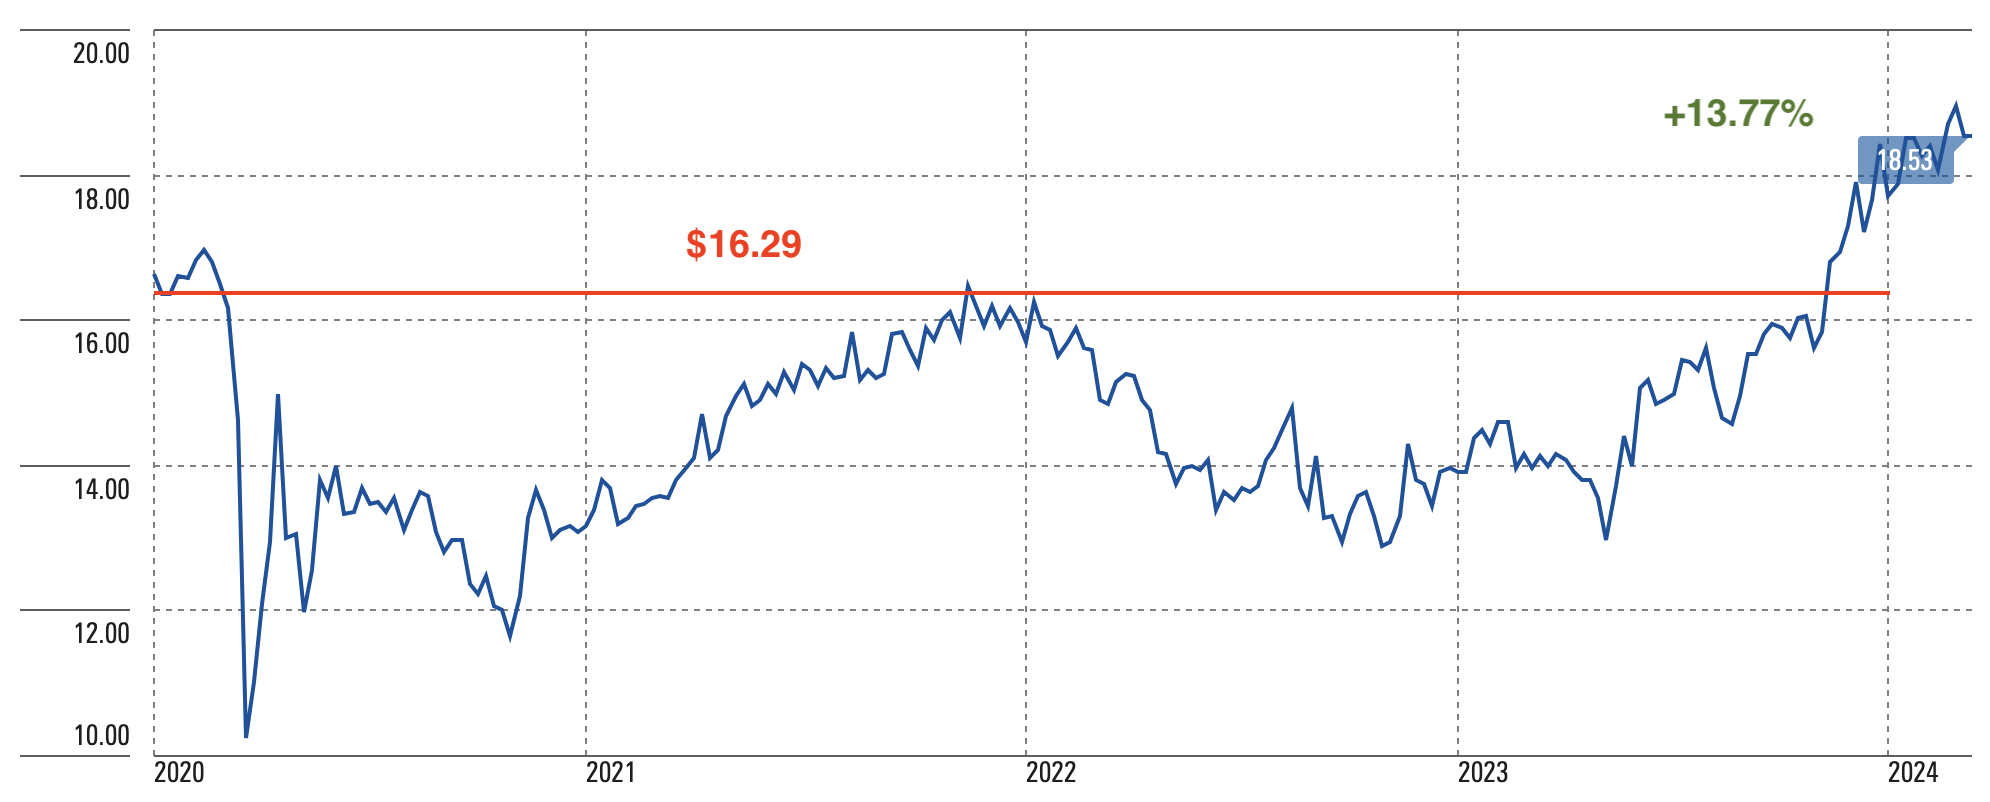
Eaton Vance Tax-Adv. Dividend Income
Price Performance (Morningstar, Author)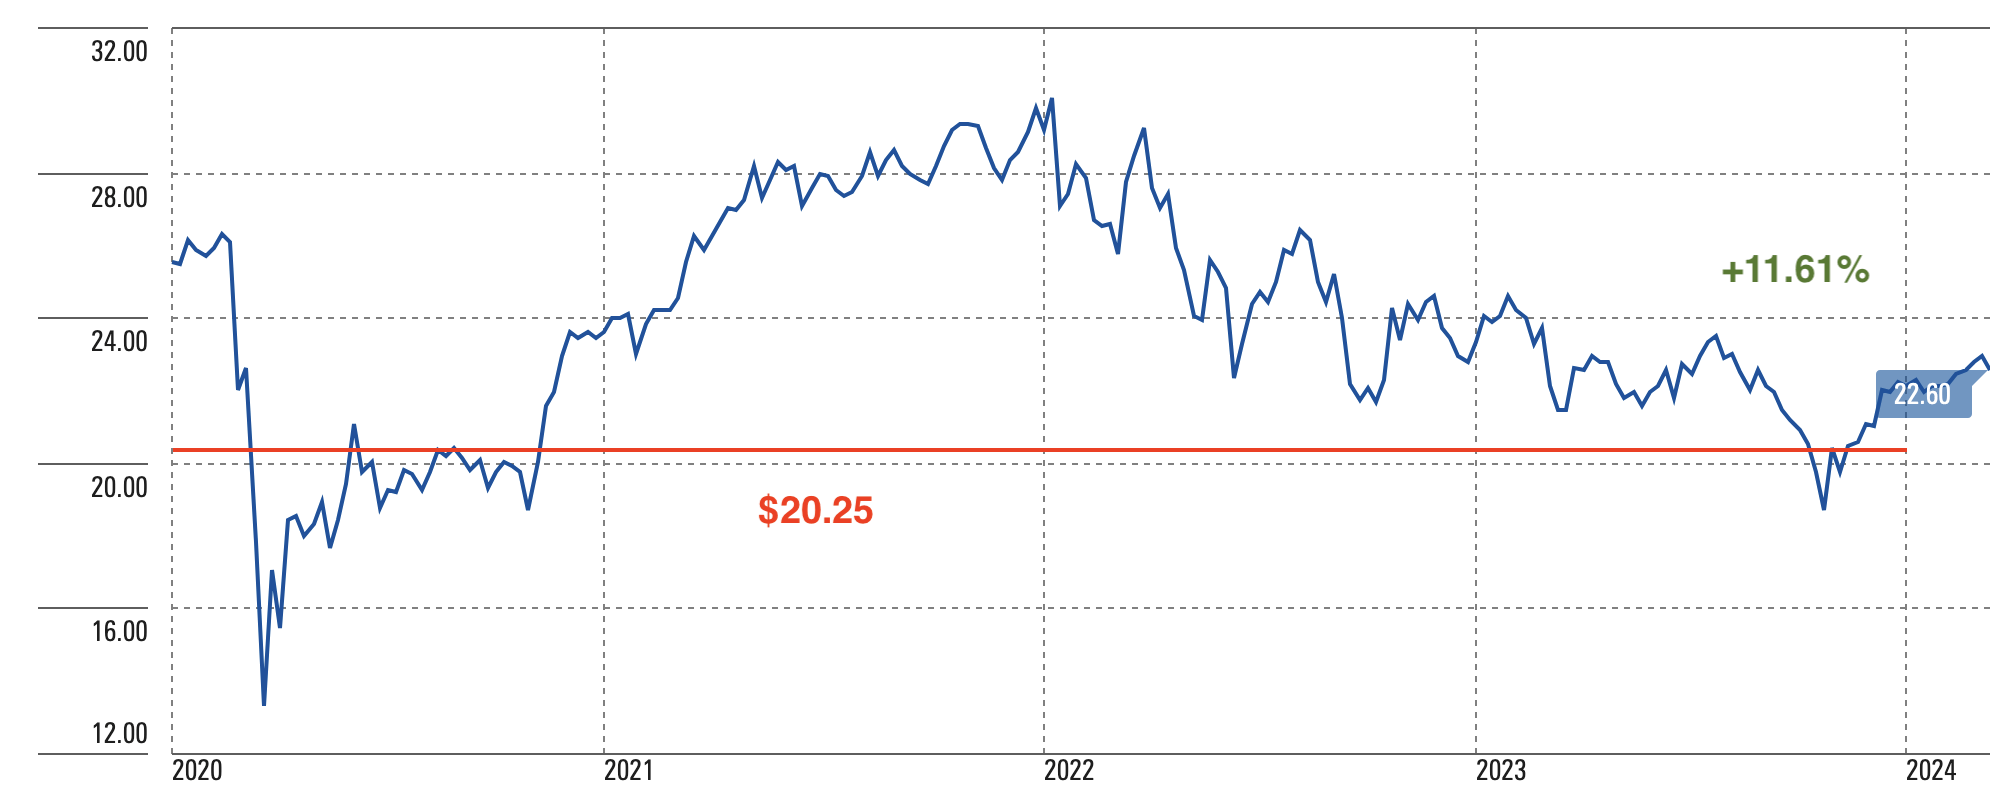
Fidus Investment
Price Performance (Morningstar, Author)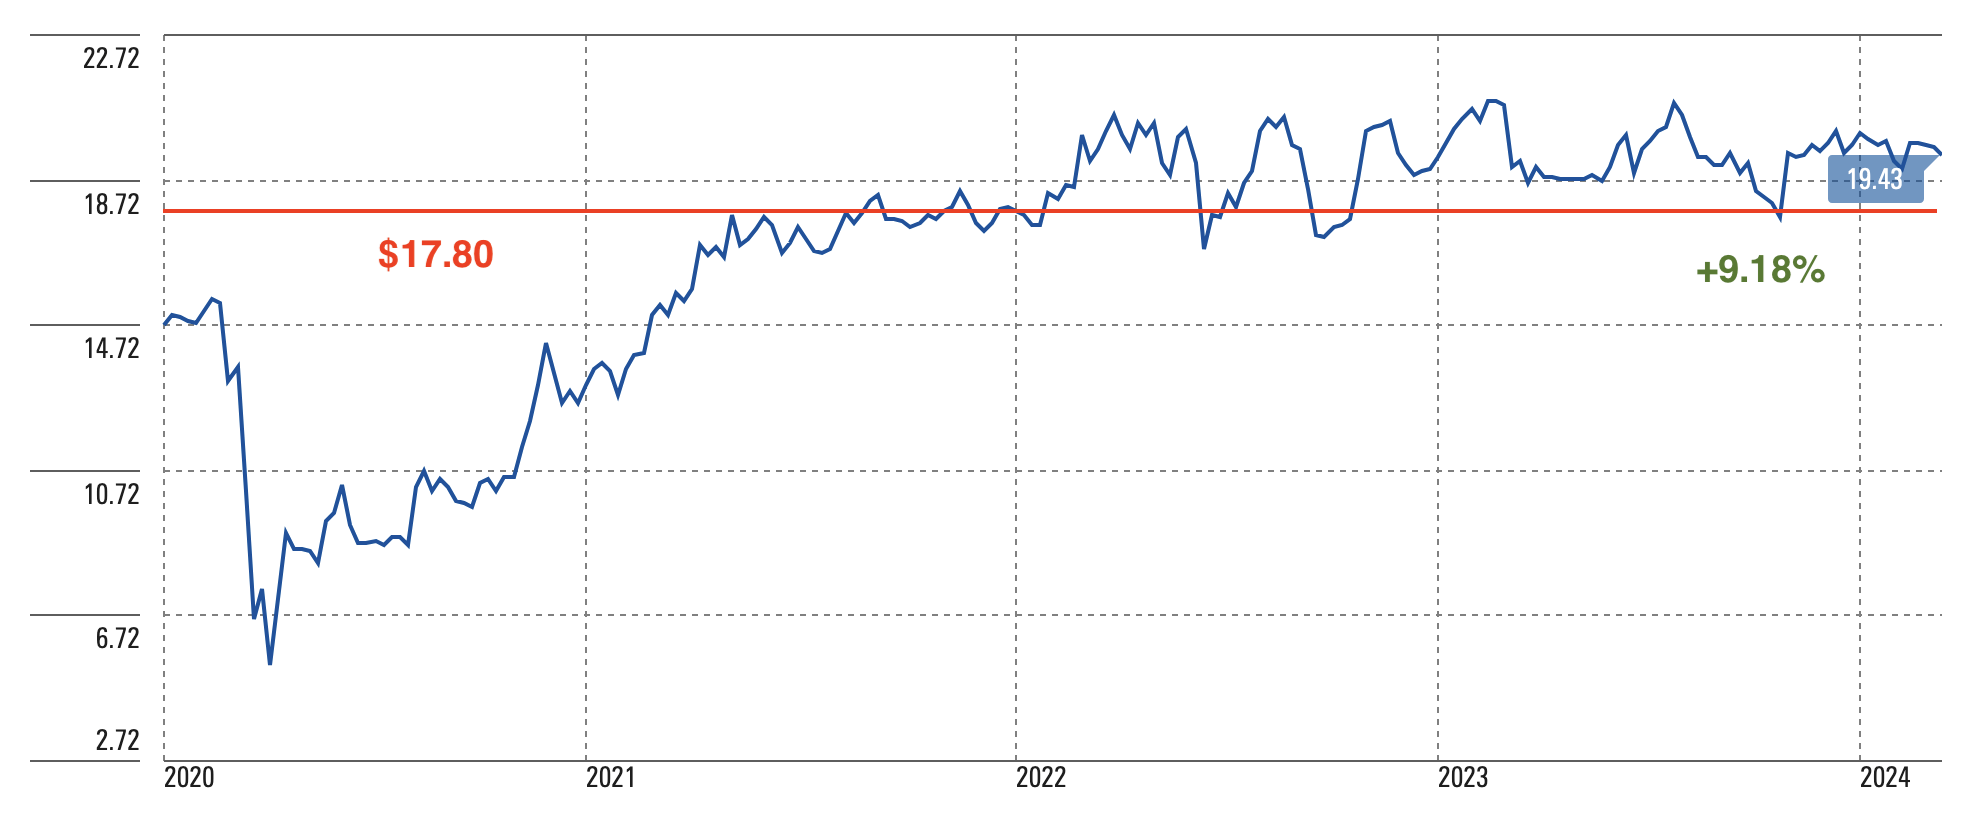
Cohen & Steers Infrastructure
Price Performance (Morningstar, Author)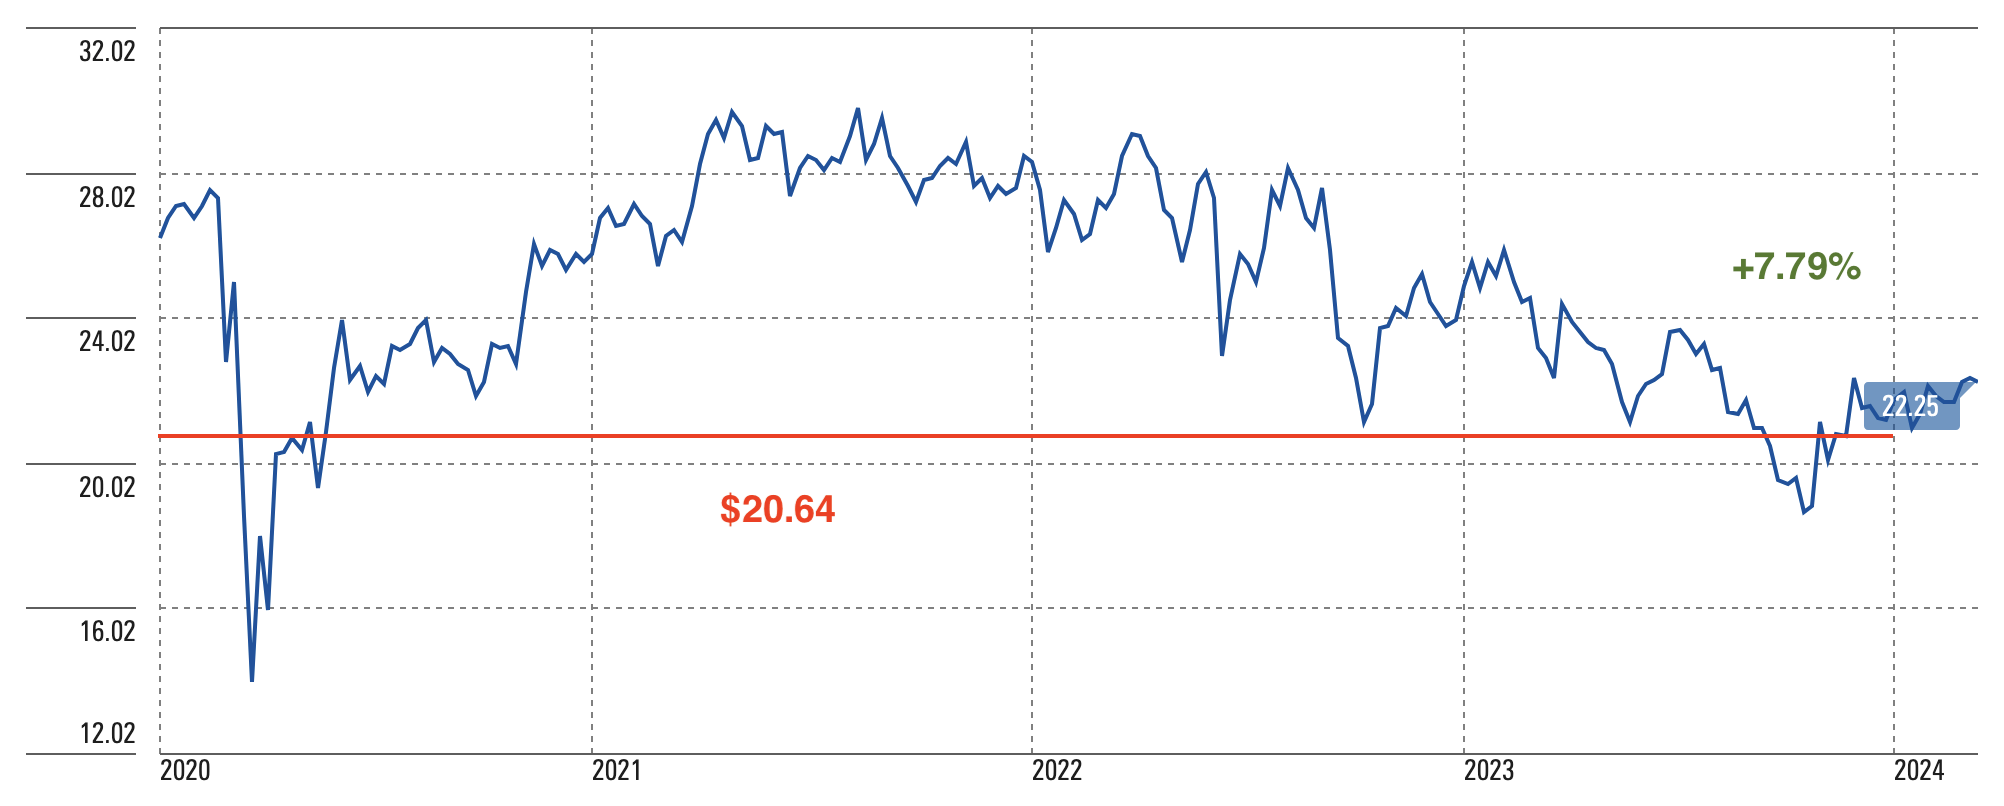
Cohen & Steers Quality Income Realty
Price Performance (Morningstar, Author)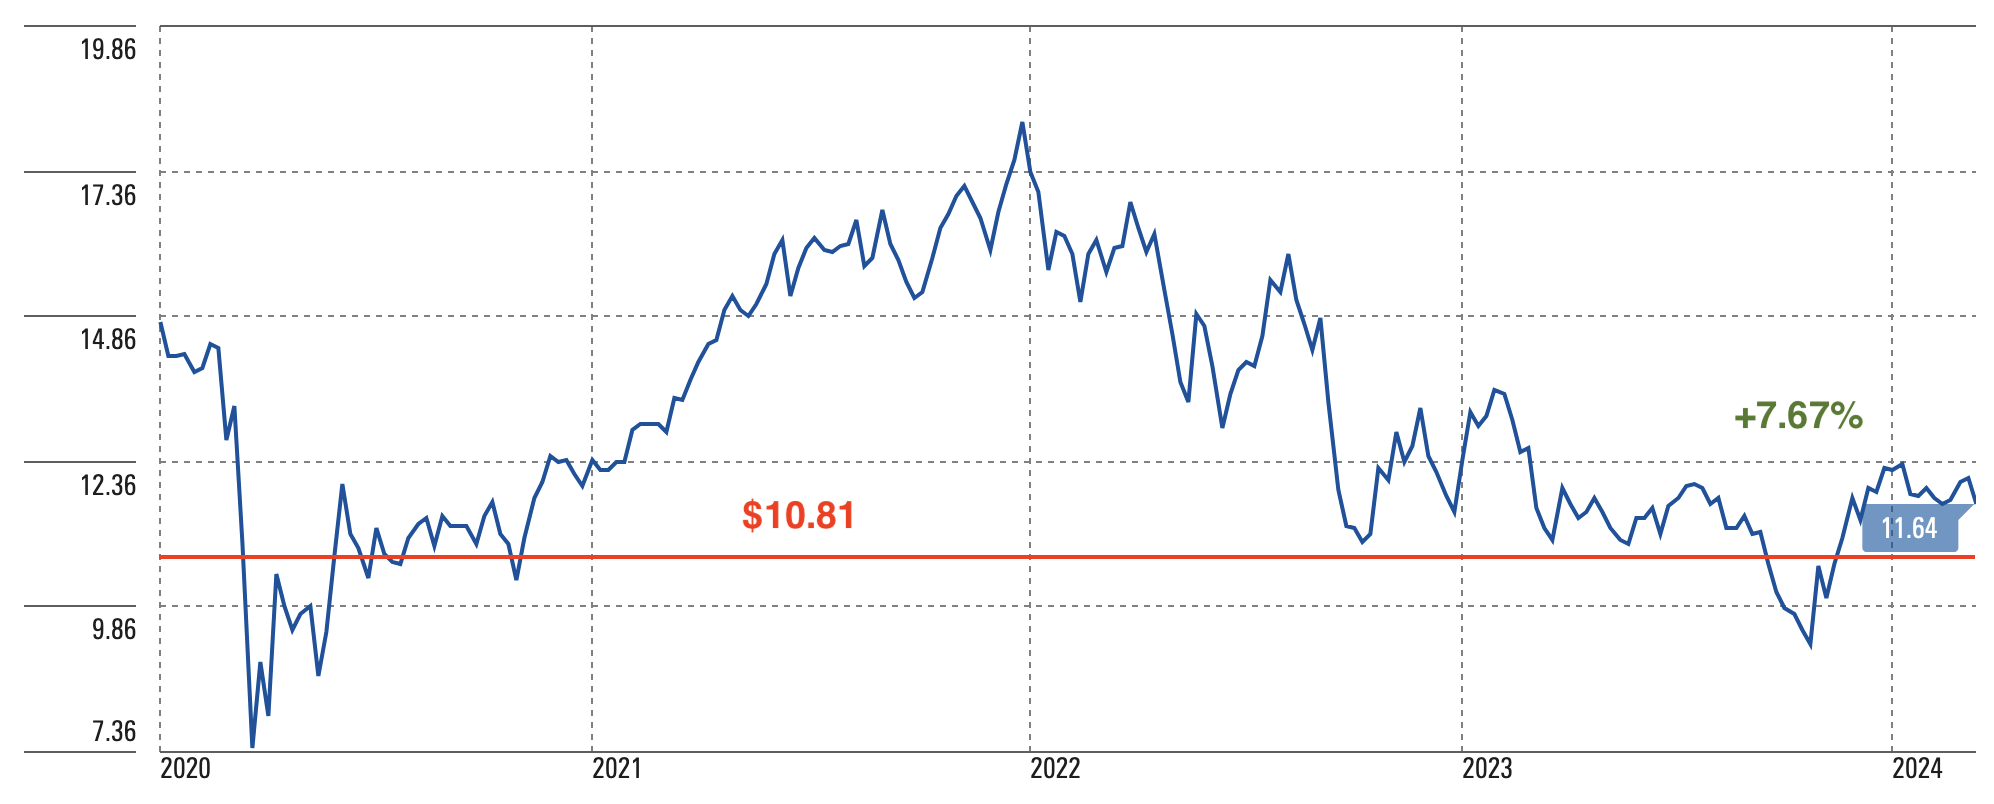
Credit Suisse X Links Crude Oil Shares Covered Call ETN
Price Performance (Morningstar, Author)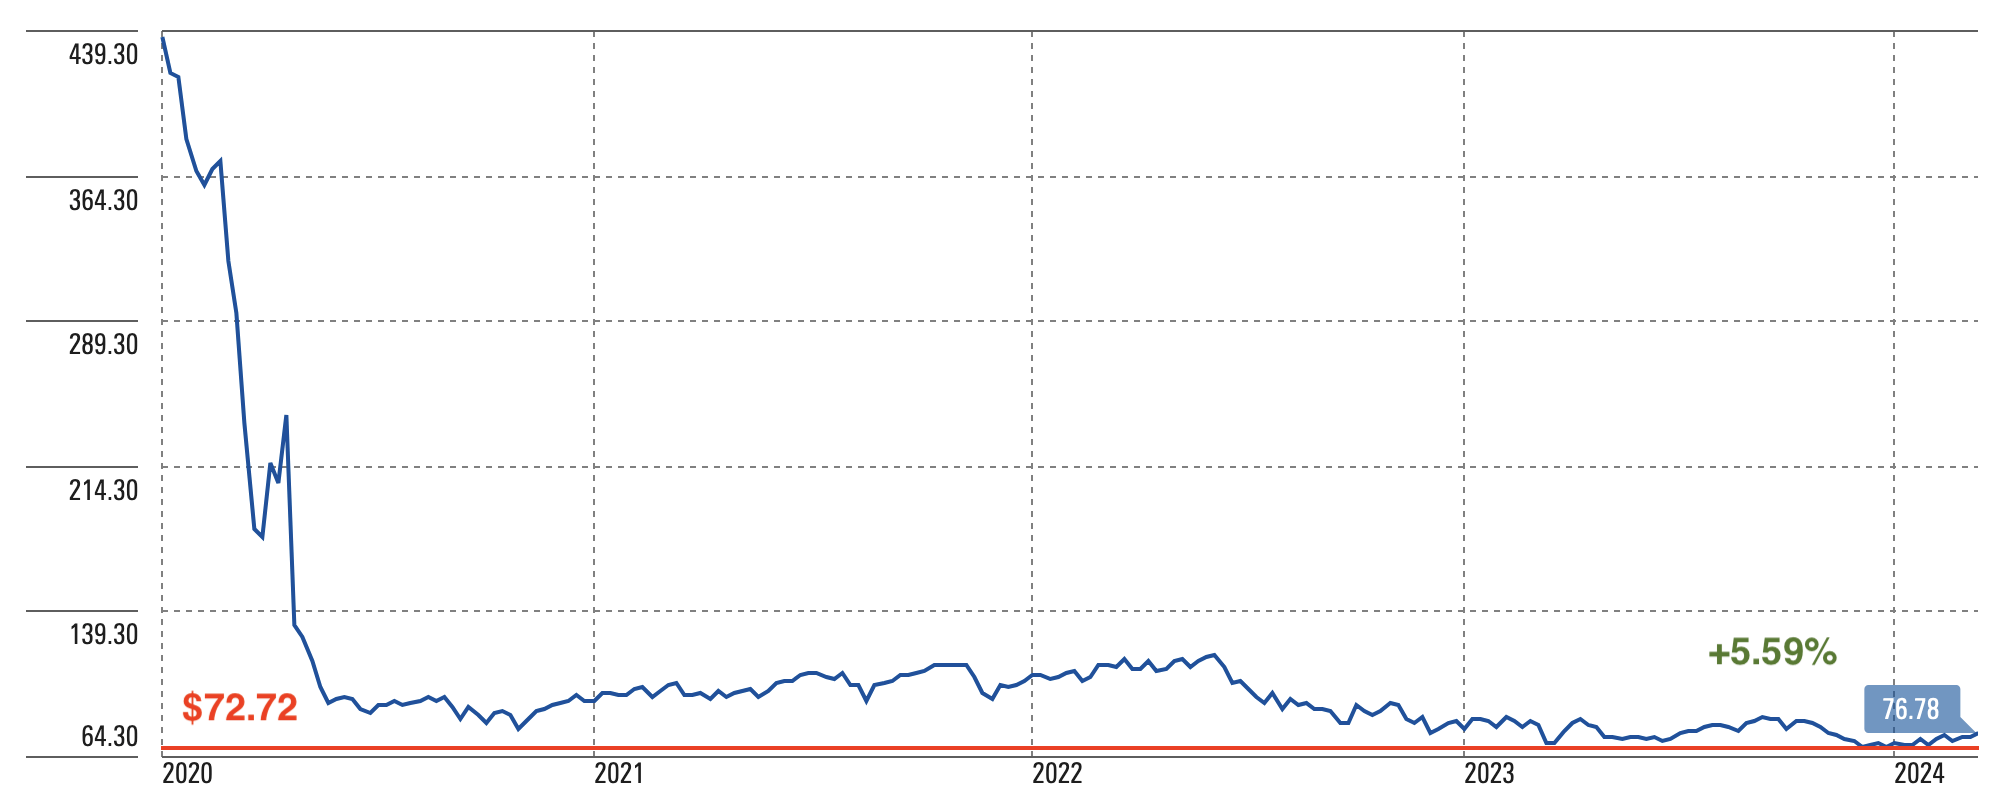
Ares Capital
Price Performance (Morningstar, Author)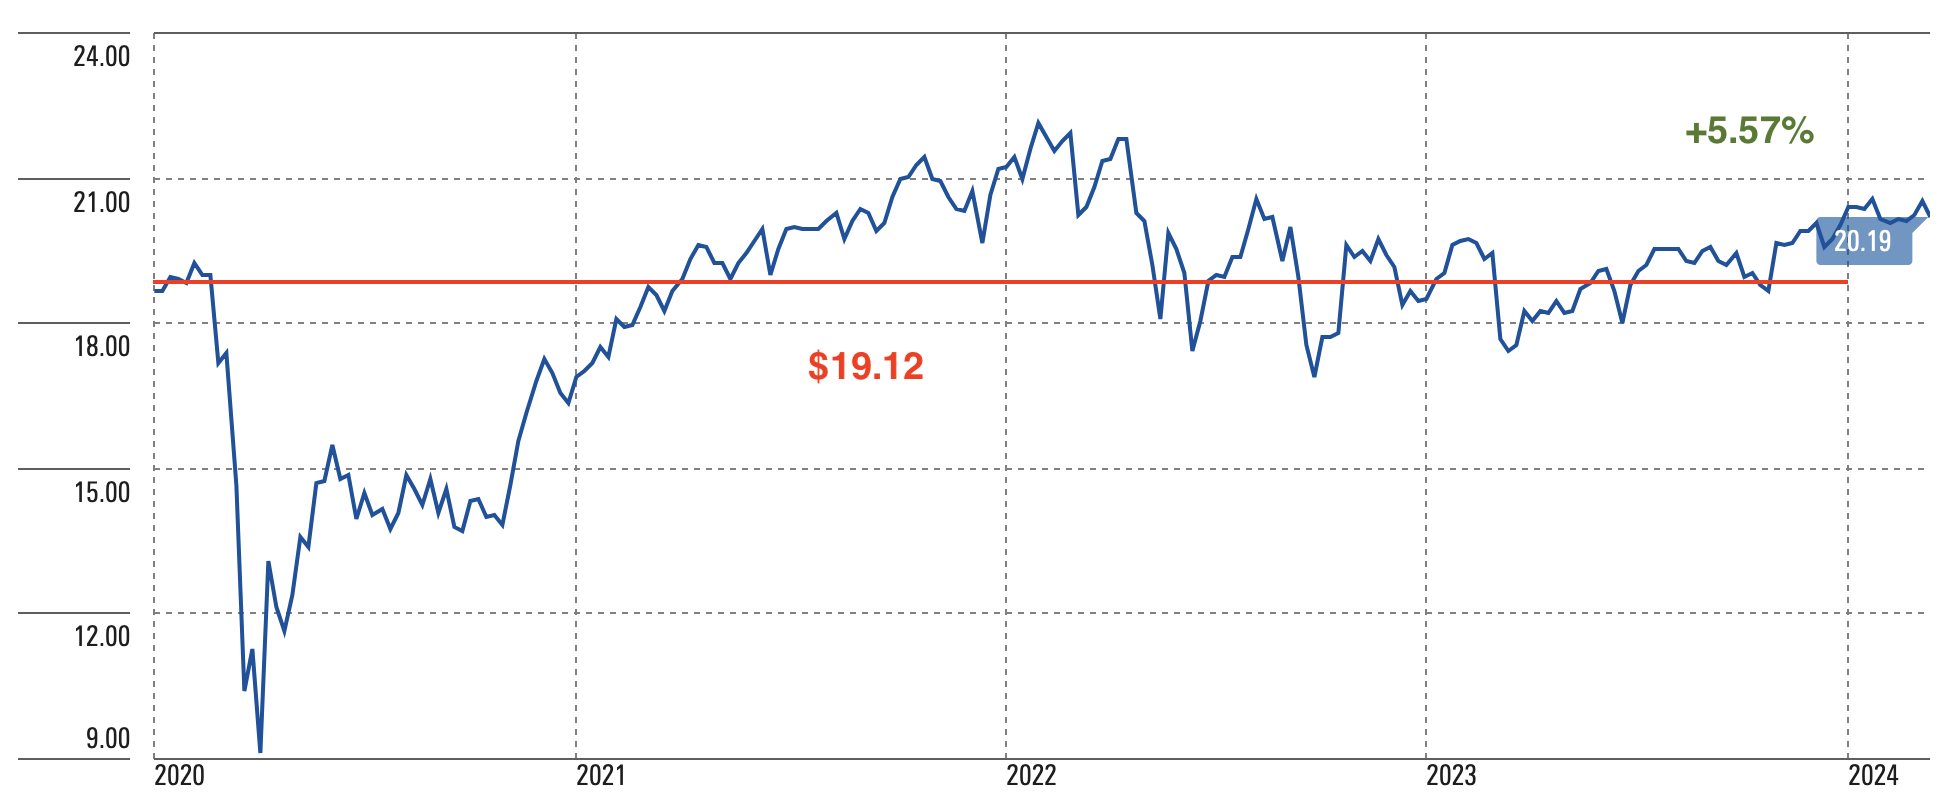
PIMCO Corporate & Income Opportunities
Price Performance (Morningstar, Author)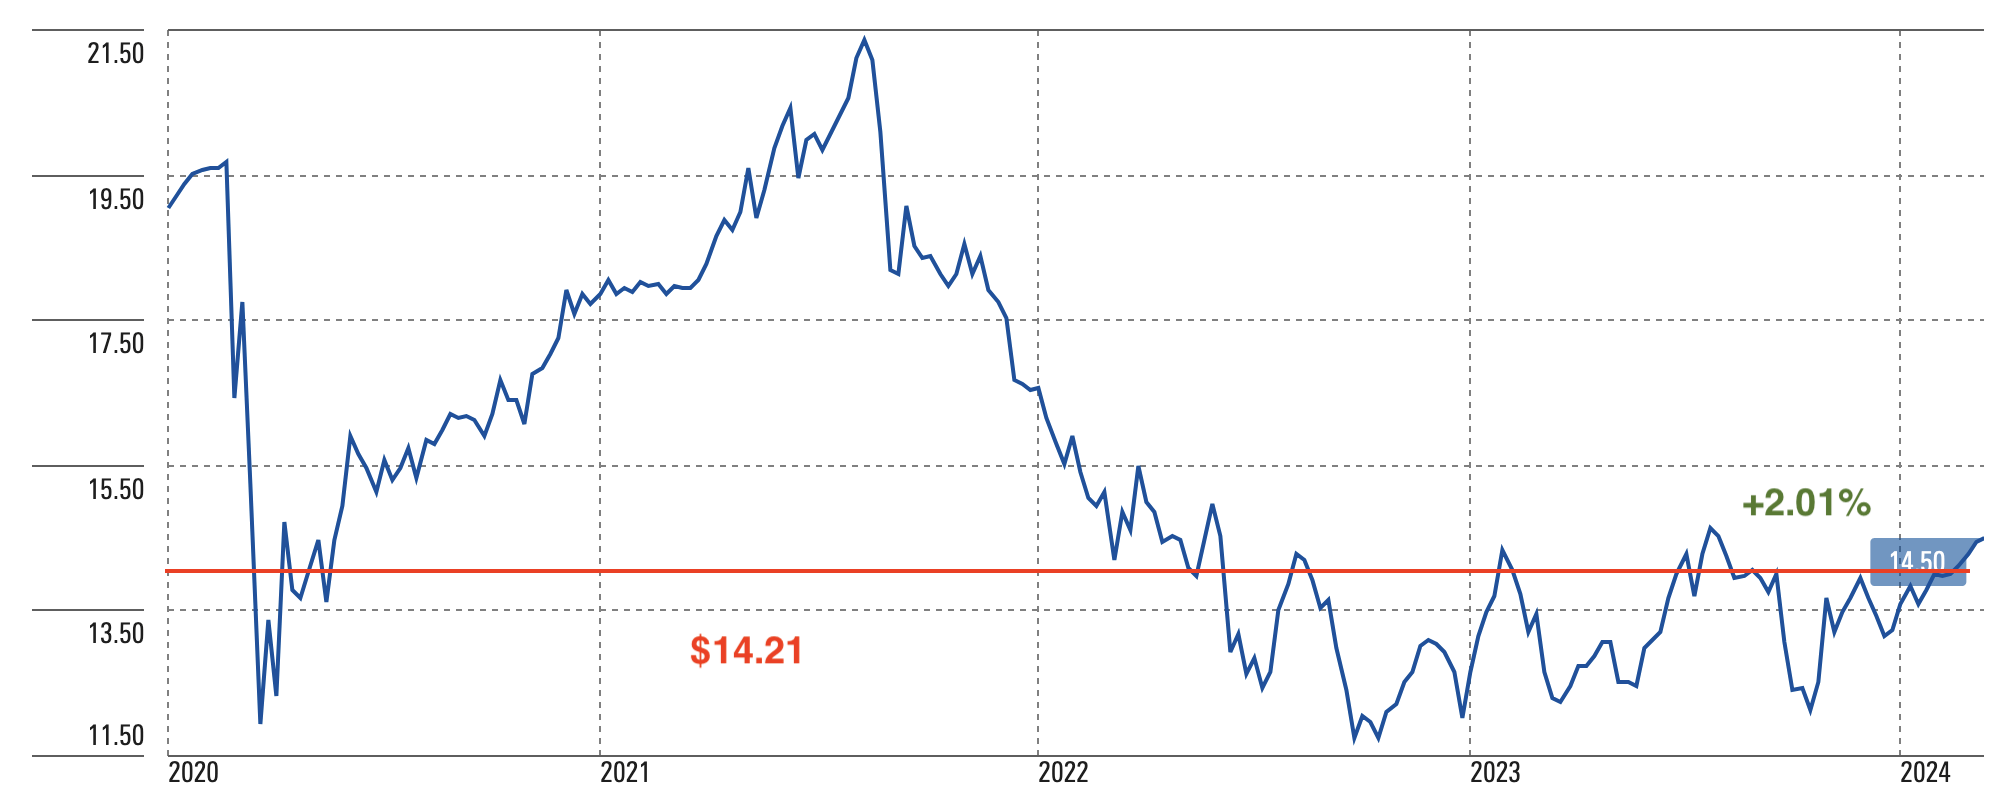
Eaton Vance Enhanced Equity Income II
Price Performance (Morningstar, Author)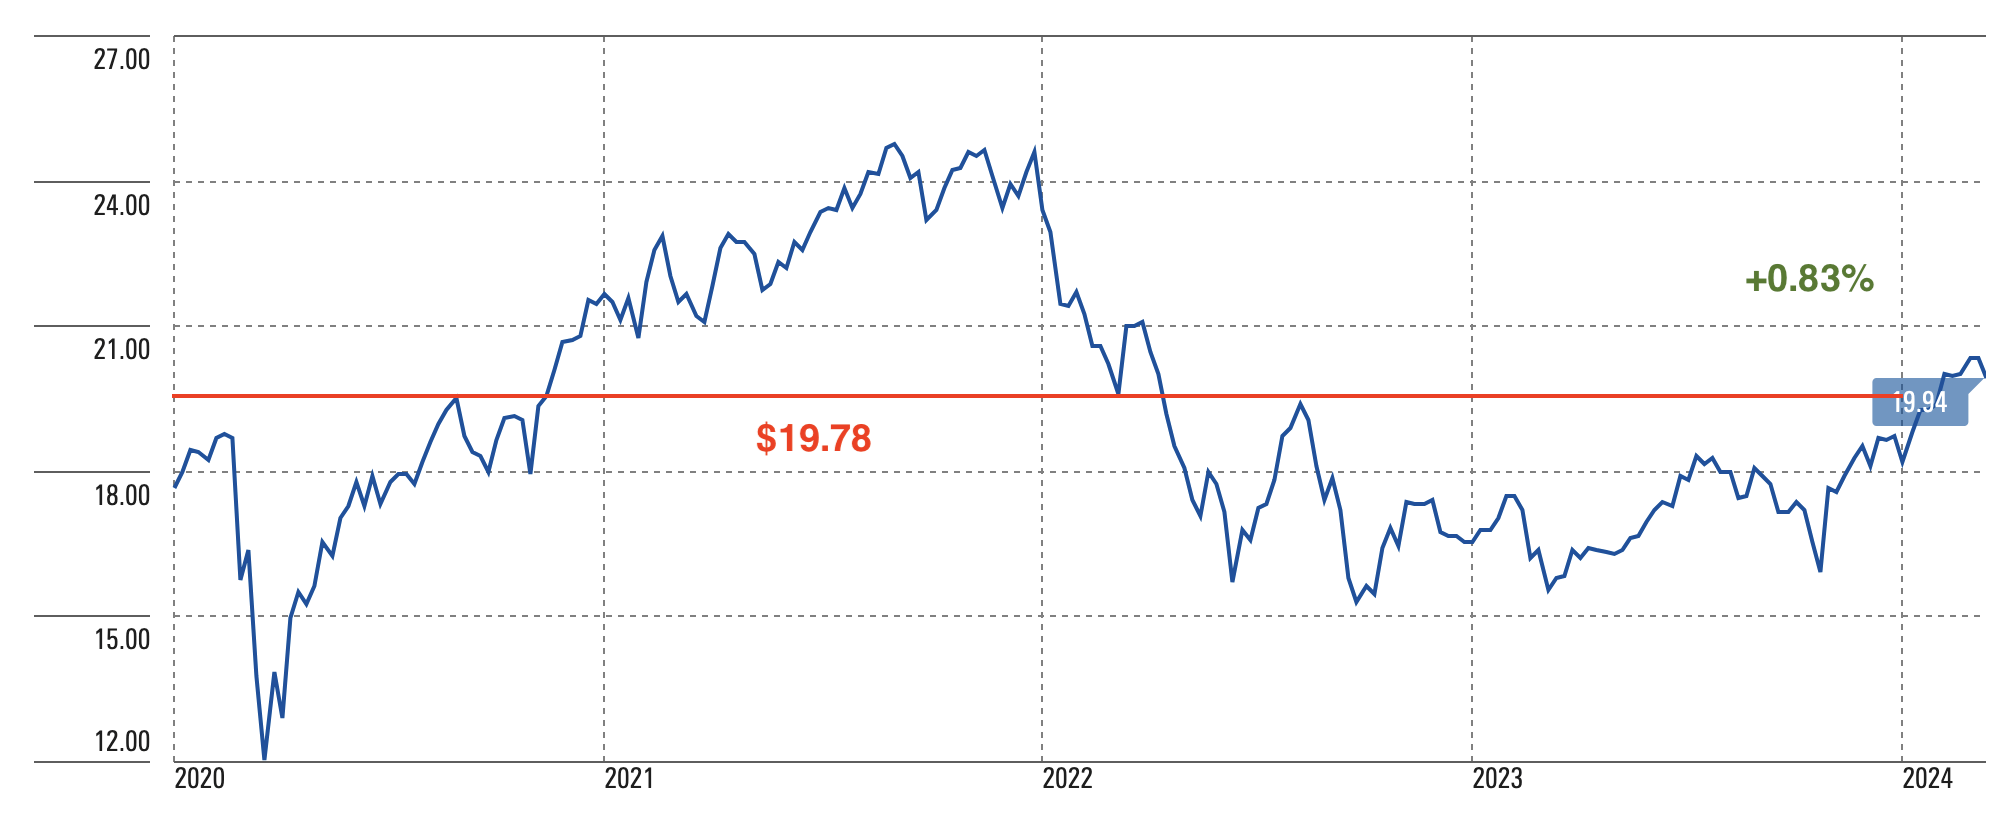
John Hancock Tax-Adv. Dividend Income
Price Performance (Morningstar, Author)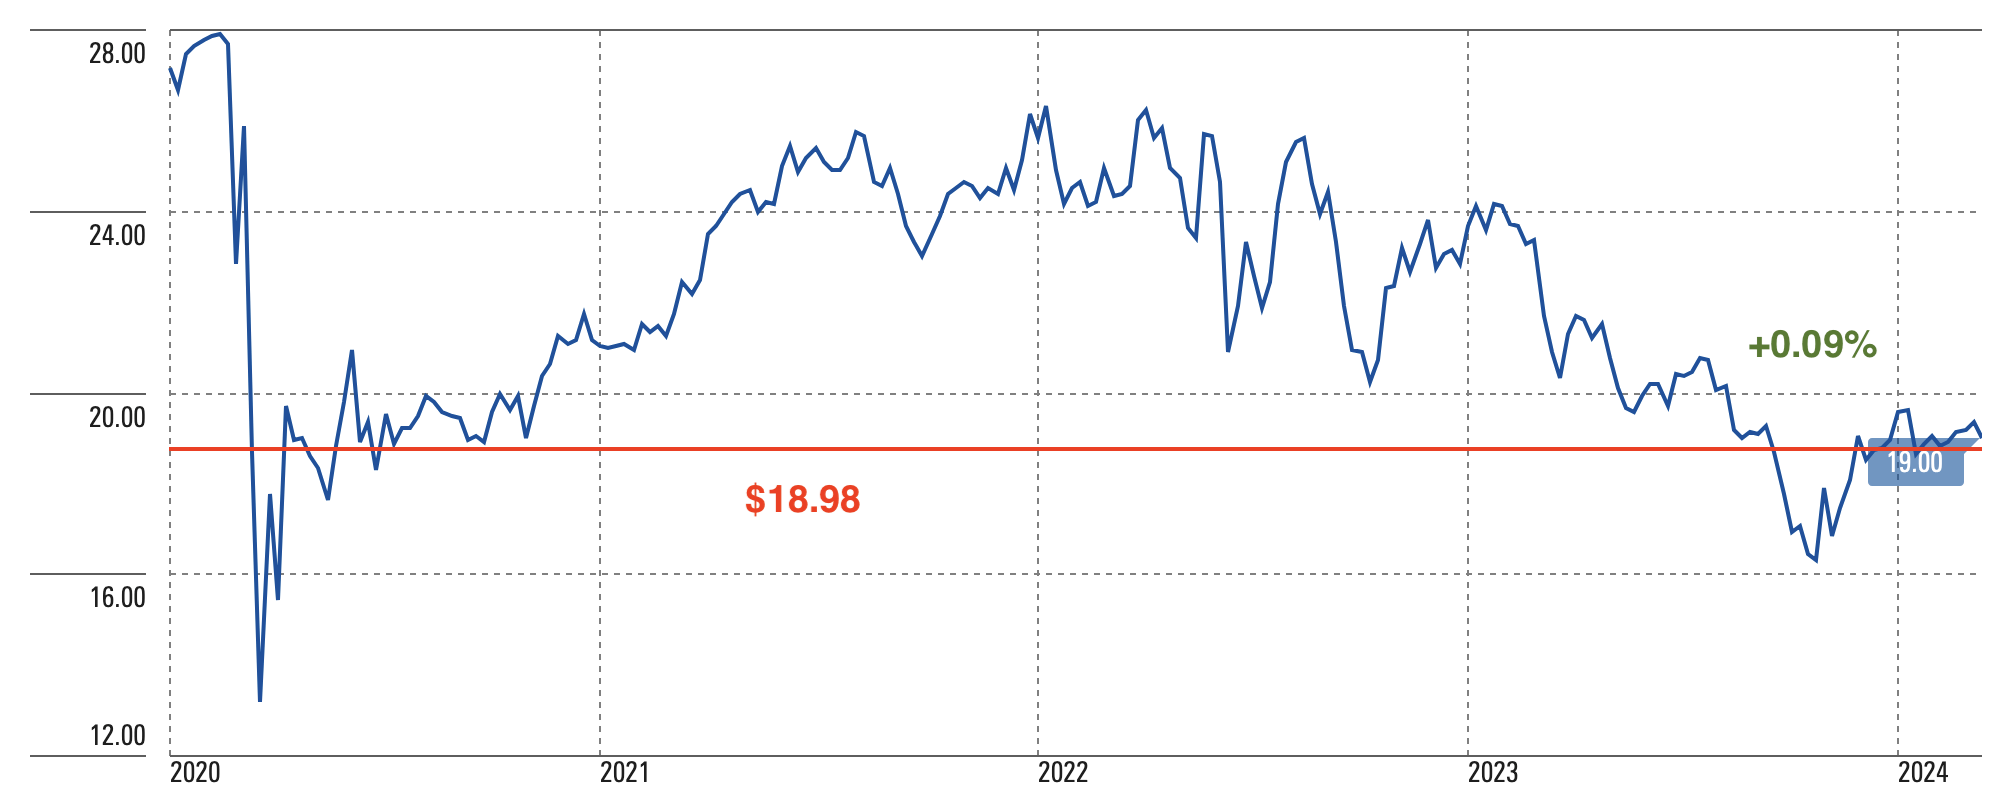
In contrast, the following seven securities show a loss of less than 10 percent, from the PCN multisector bond fund to the UTG utilities fund, a CEF launched twenty years ago, whose NAV is in largely positive territory.
PIMCO Corporate & Income Strategy
Price Performance (Morningstar, Author)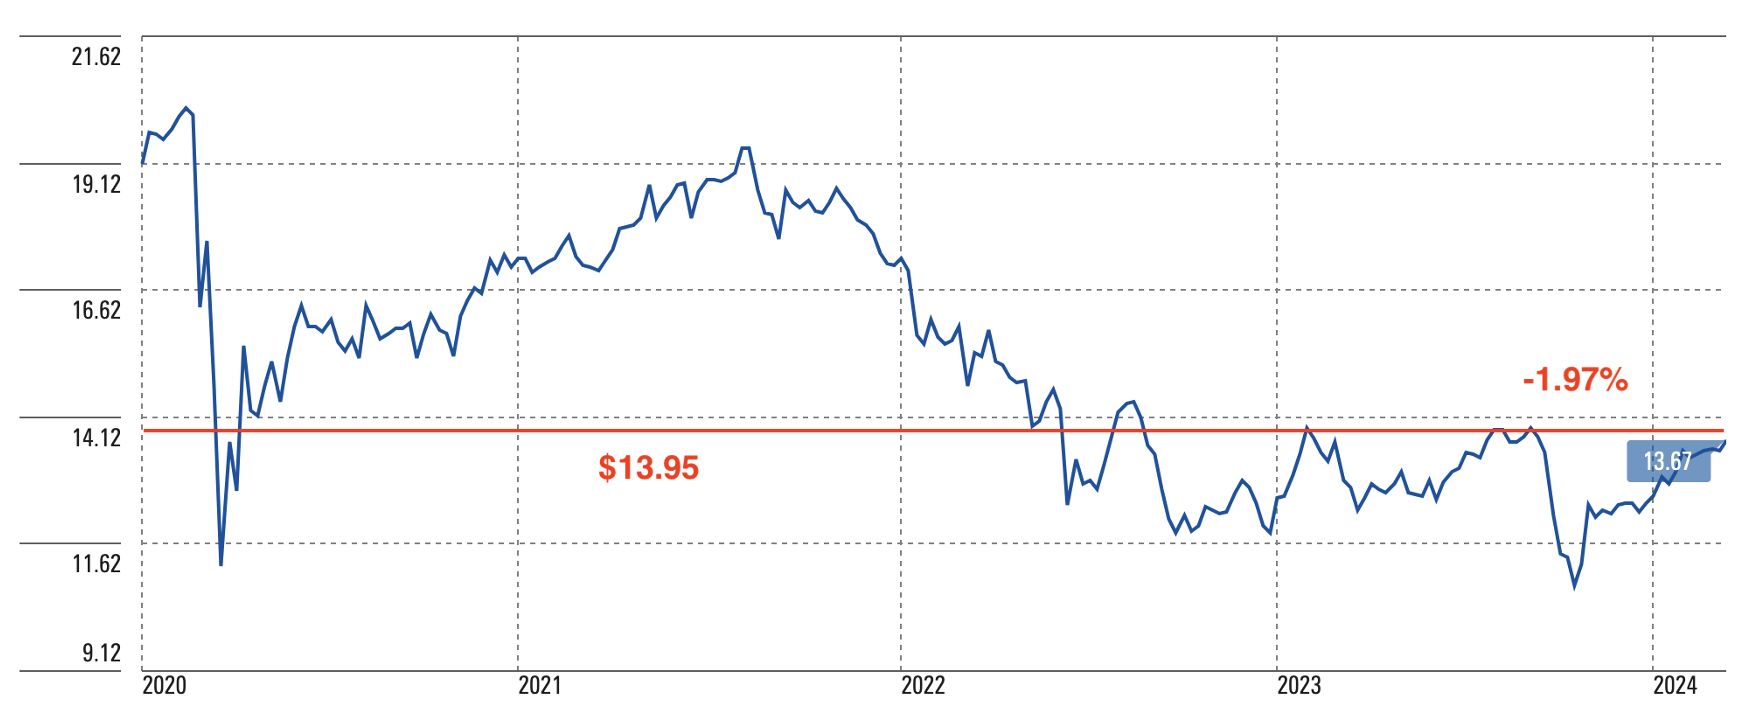
JPMorgan Equity Premium Income
Price Performance (Morningstar, Author)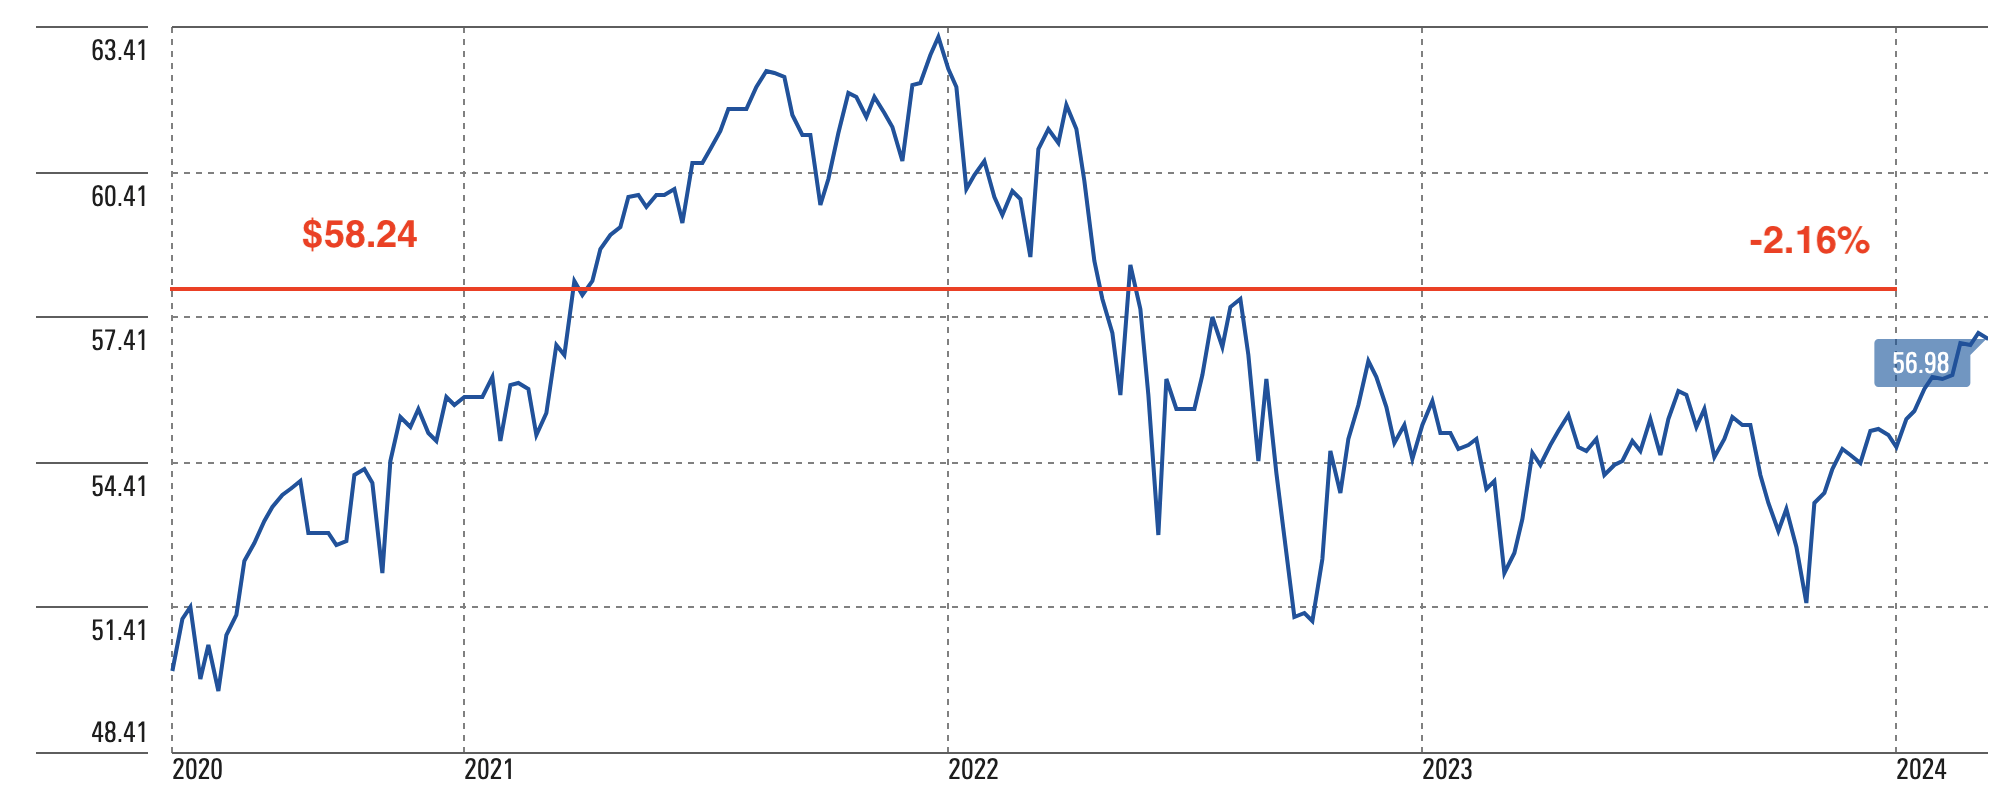
BlackRock Science And Technology Trust
Price Performance (Morningstar, Author)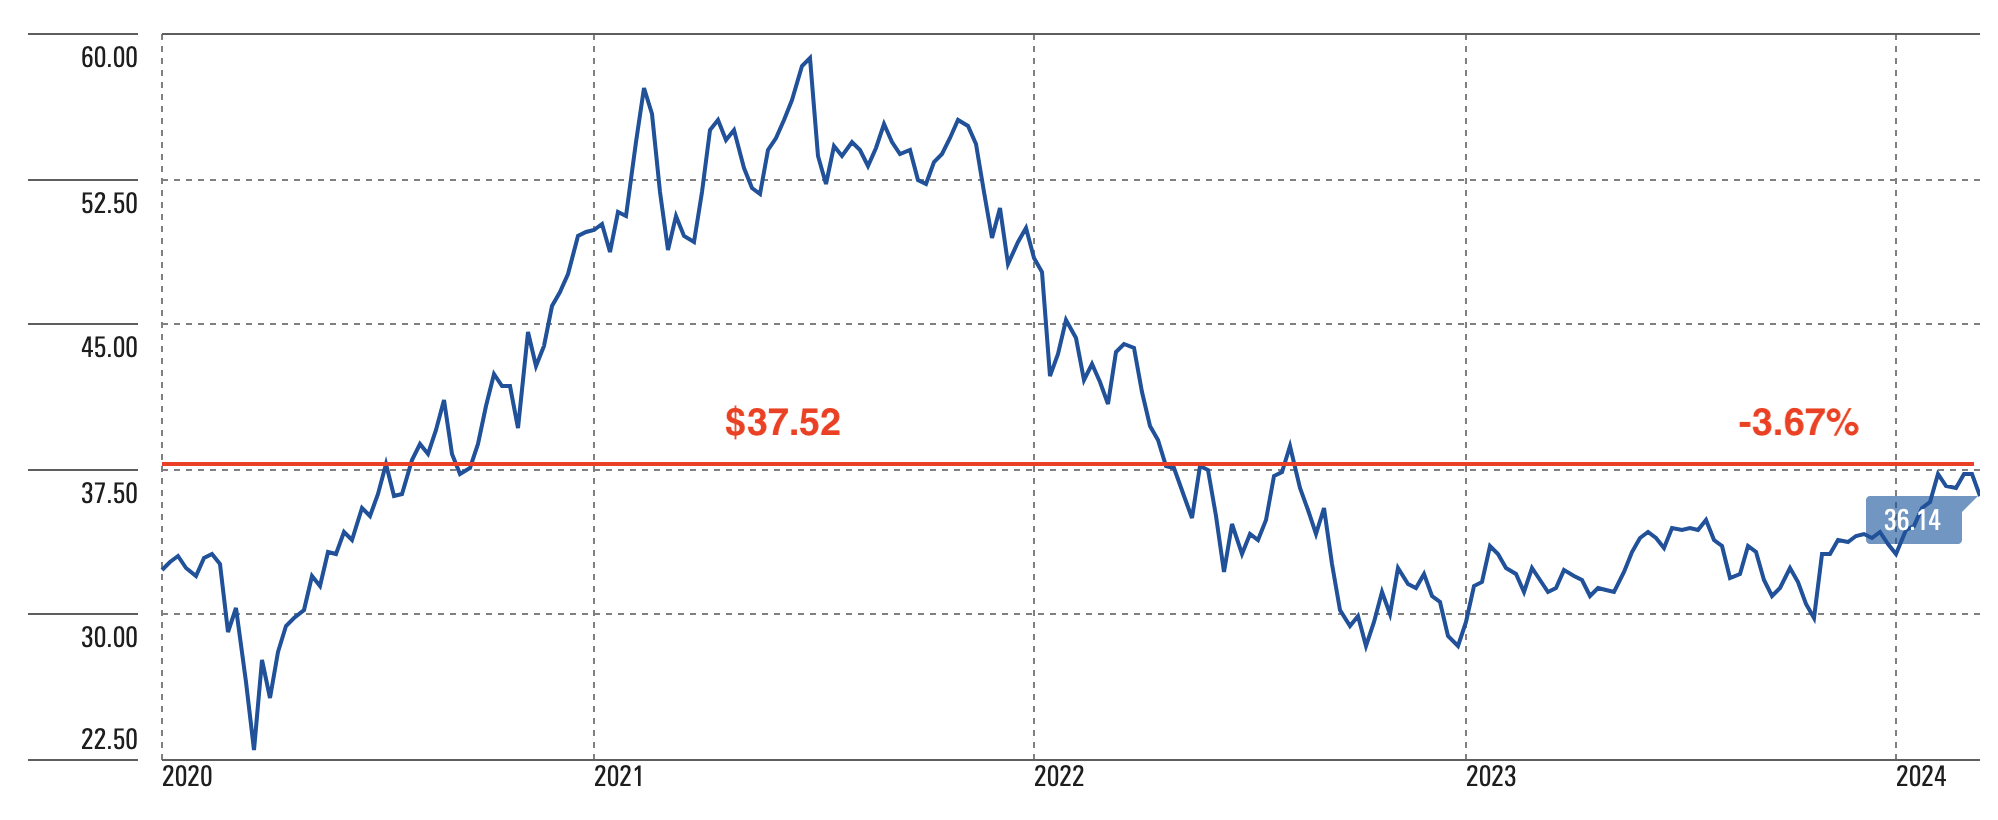
John Hancock Premium Dividend
Price Performance (Morningstar, Author)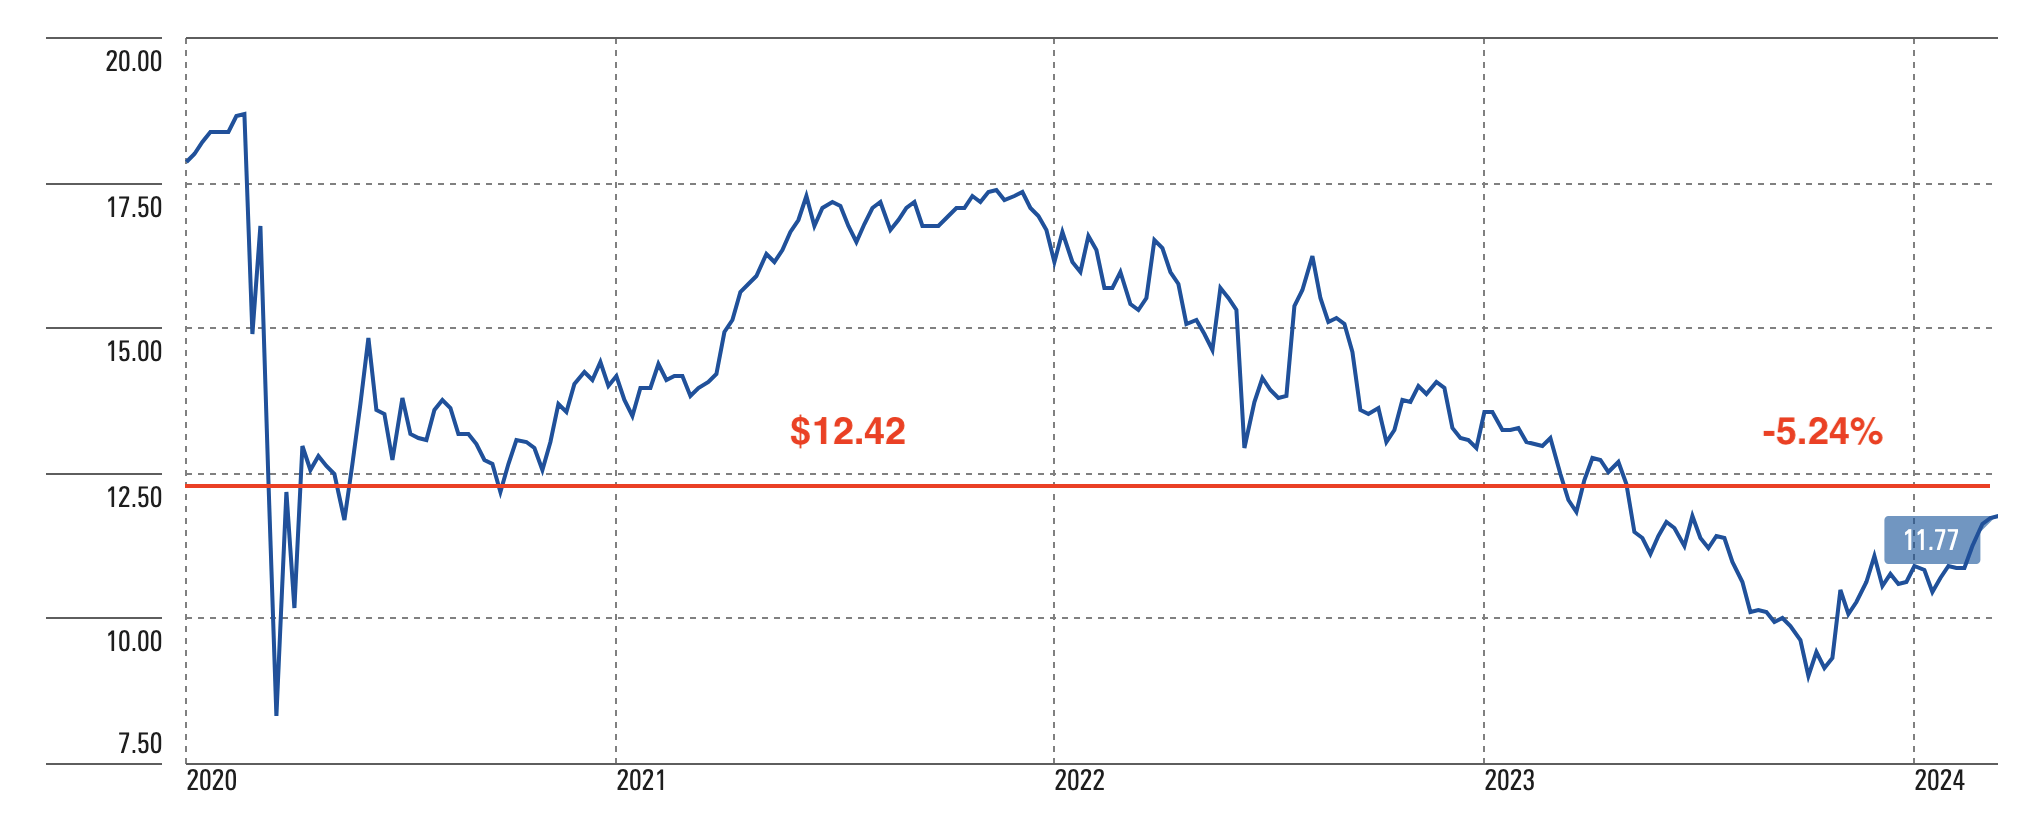
XAI Octagon FR & Alt Income Term Trust
Price Performance (Morningstar, Author)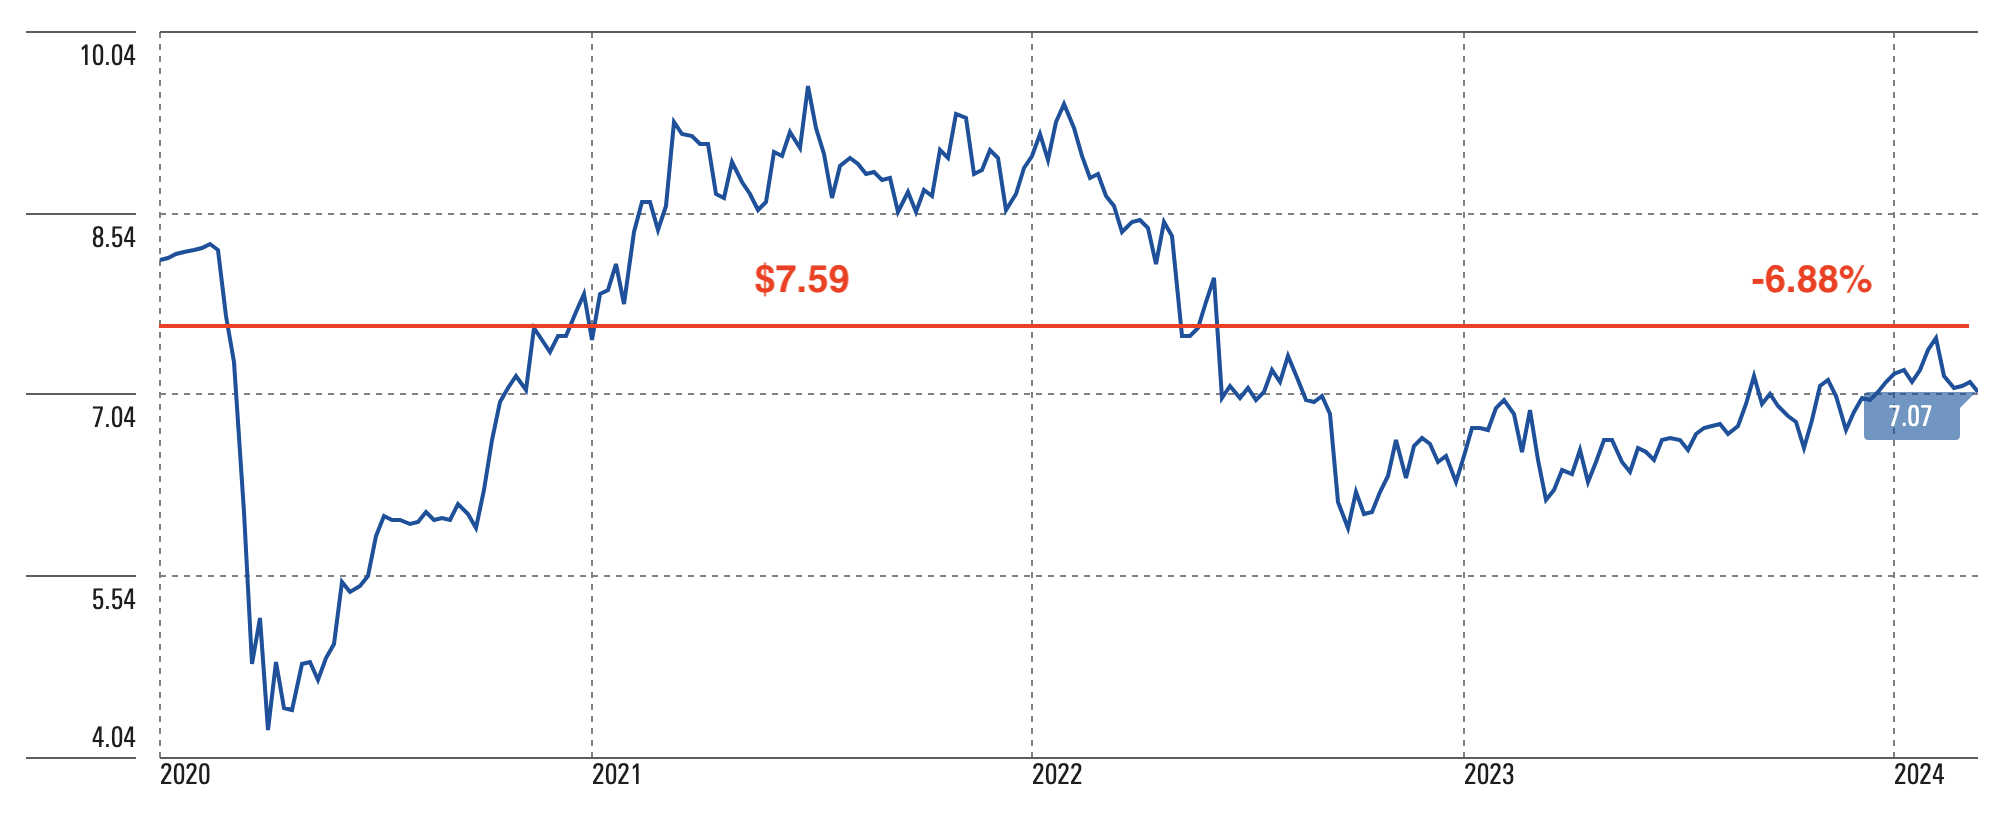
Royce Value Trust
Price Performance (Morningstar, Author)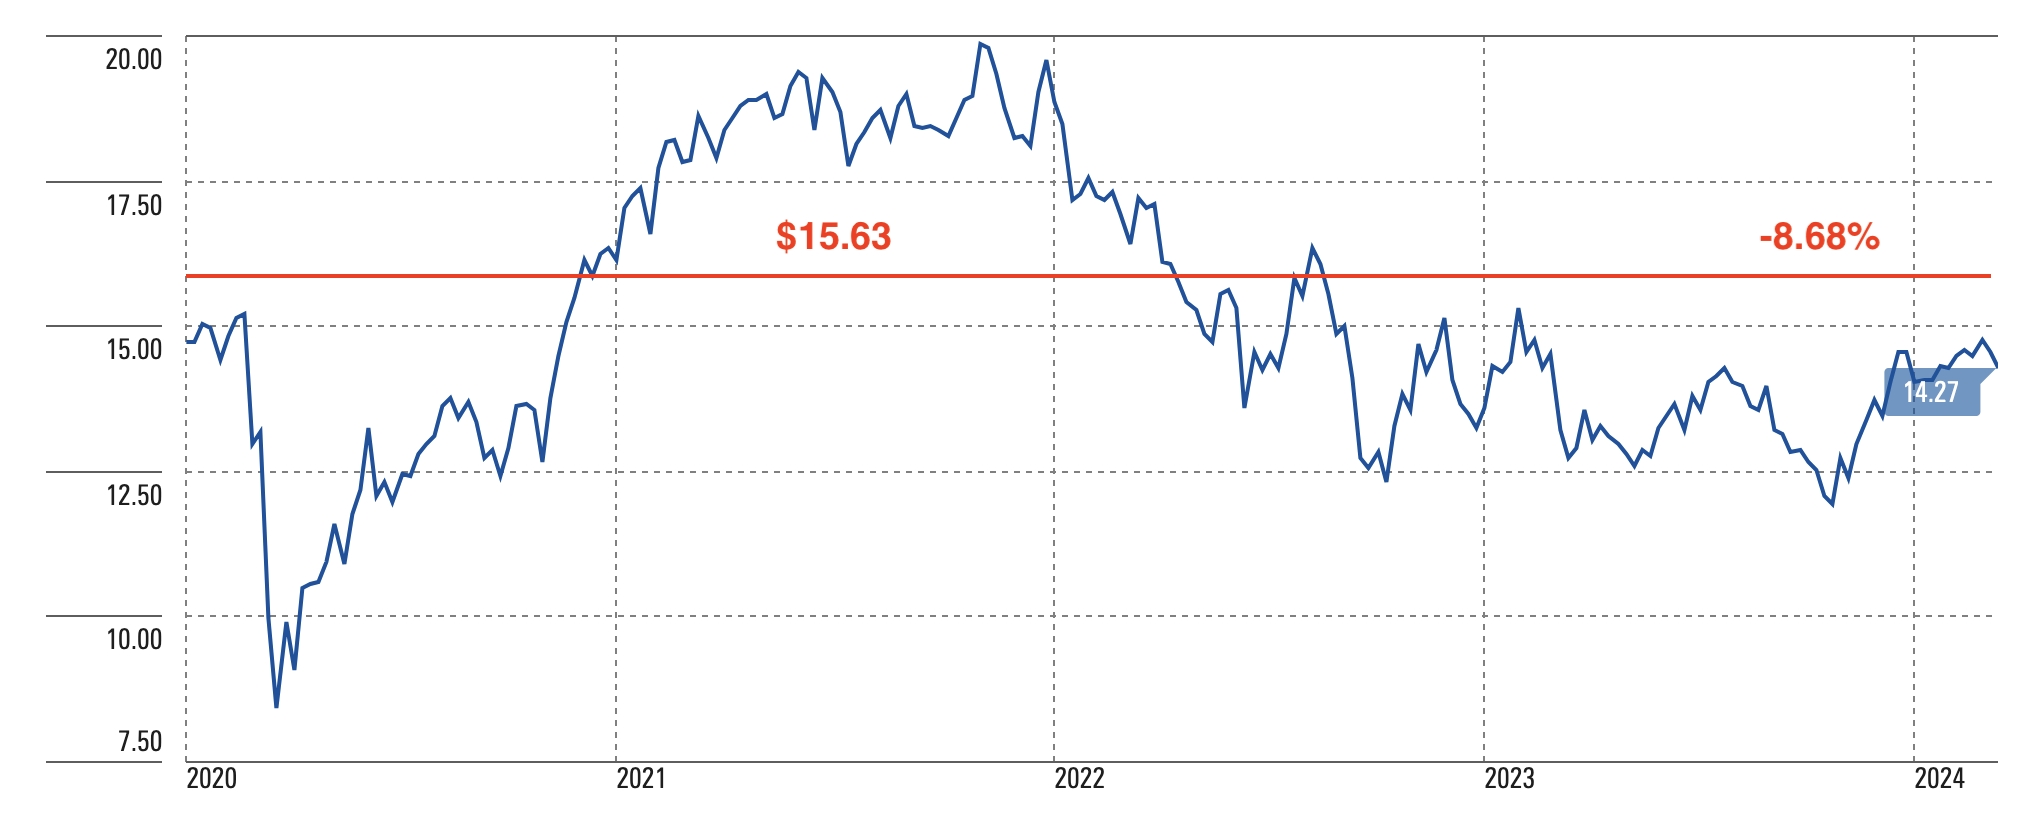
Reaves Utility Income Trust
Price Performance (Morningstar, Author)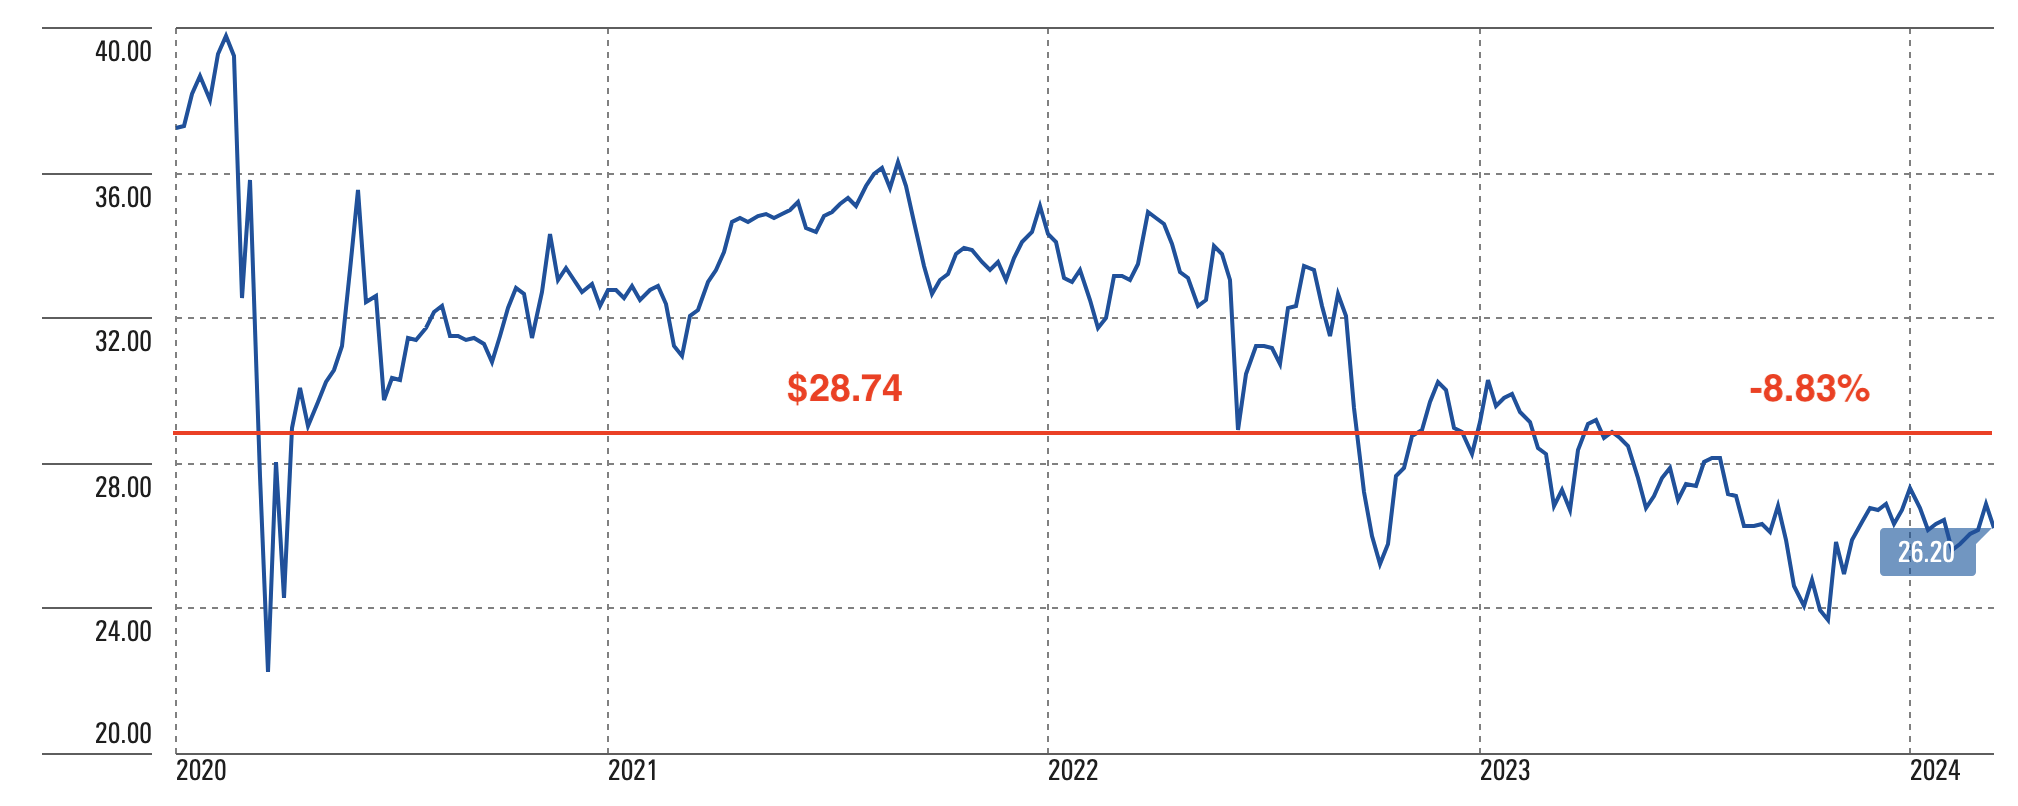
The loss of the next four securities barely exceeds 10 percent and is not particularly worrisome, although the NAV of QYLD, a covered call ETF on the Nasdaq, marks a steady decline since launch, only recently interrupted by the positive performance of its benchmark index.
Special Opportunities Fund
Price Performance (Morningstar, Author)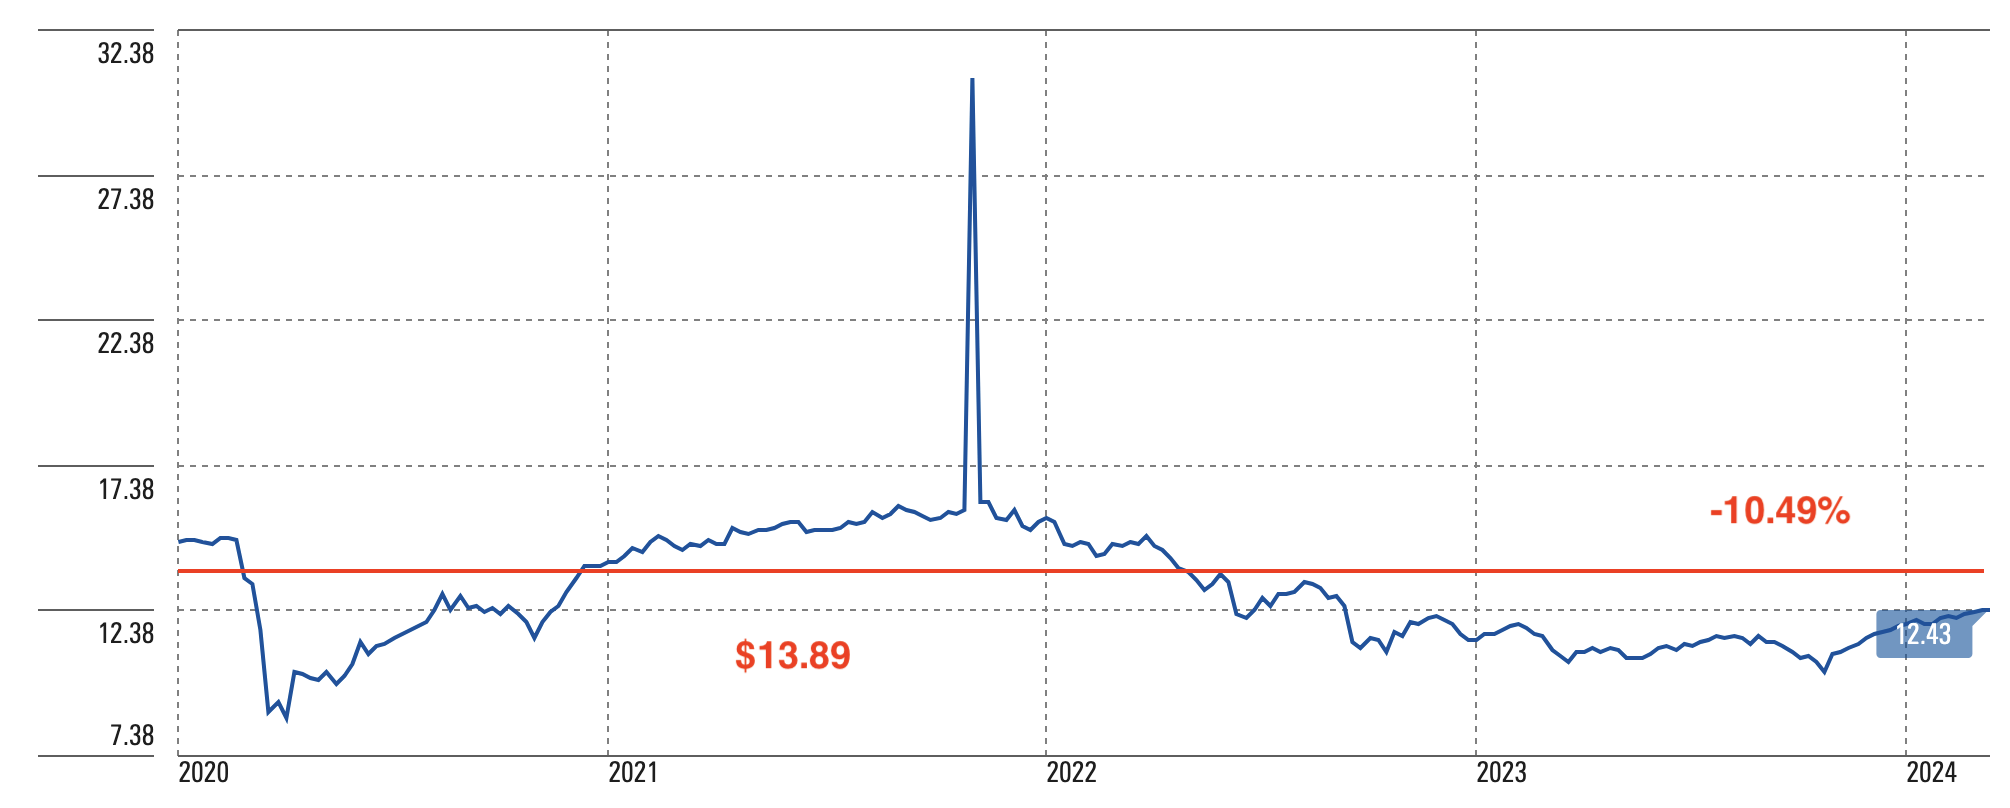
Global X S&P 500 Covered Call
Price Performance (Morningstar, Author)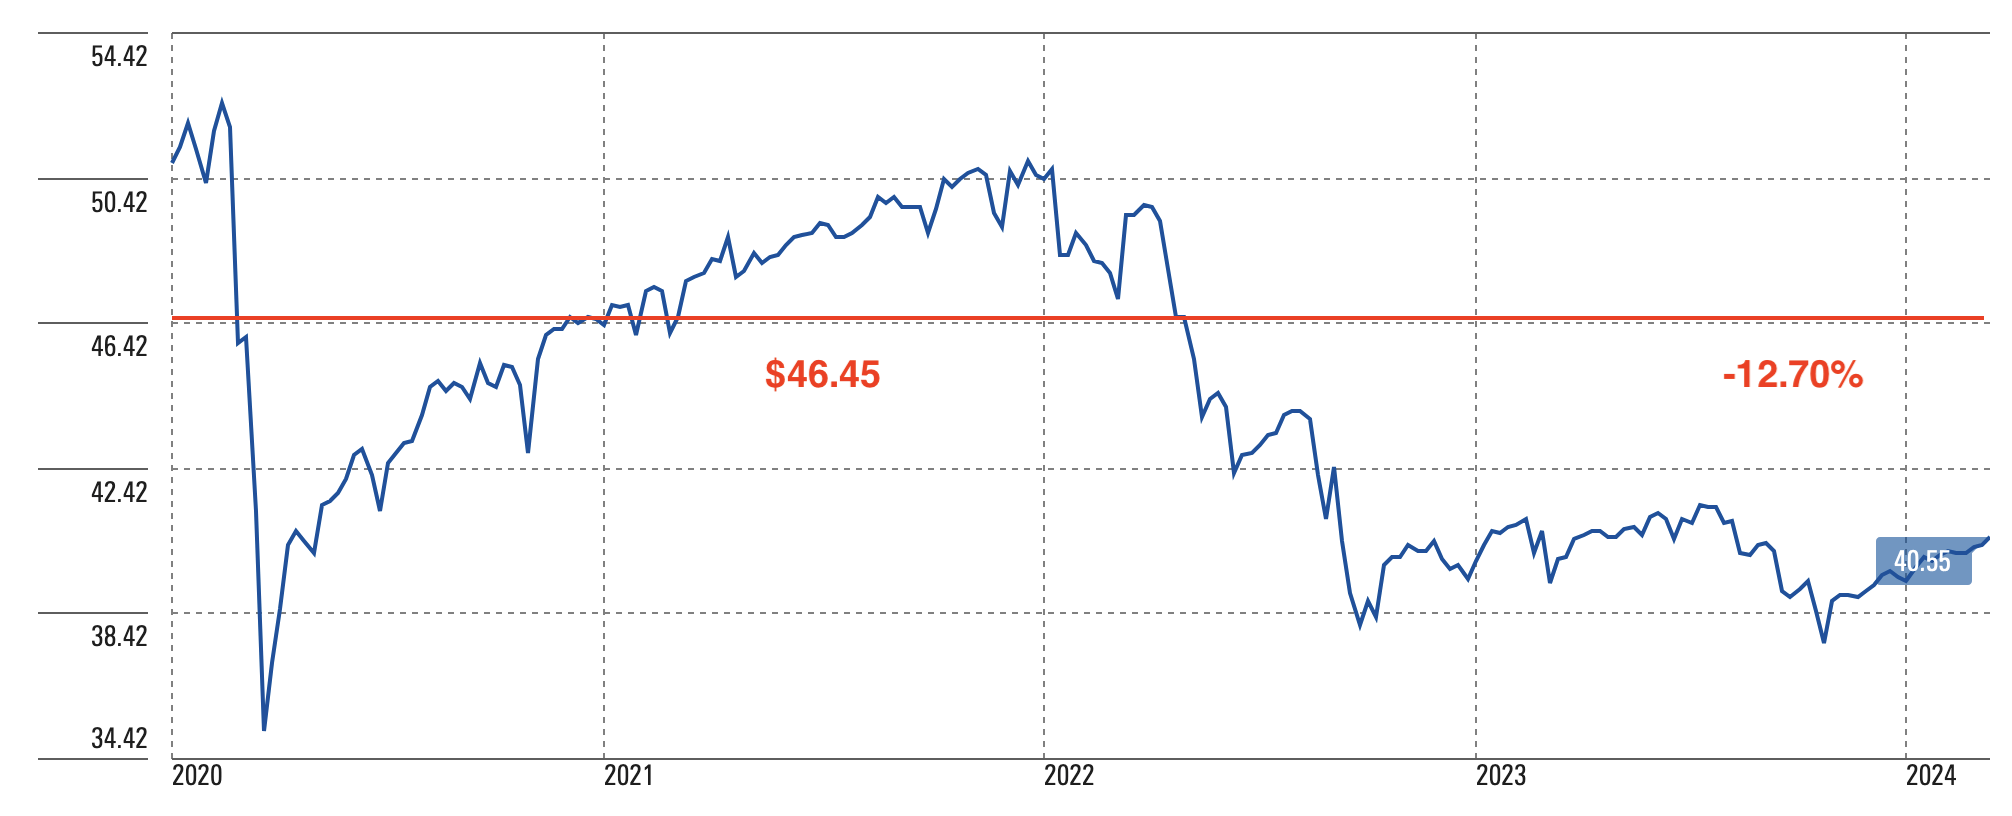
Calamos Dynamic Convertible and Income
Price Performance (Morningstar, Author)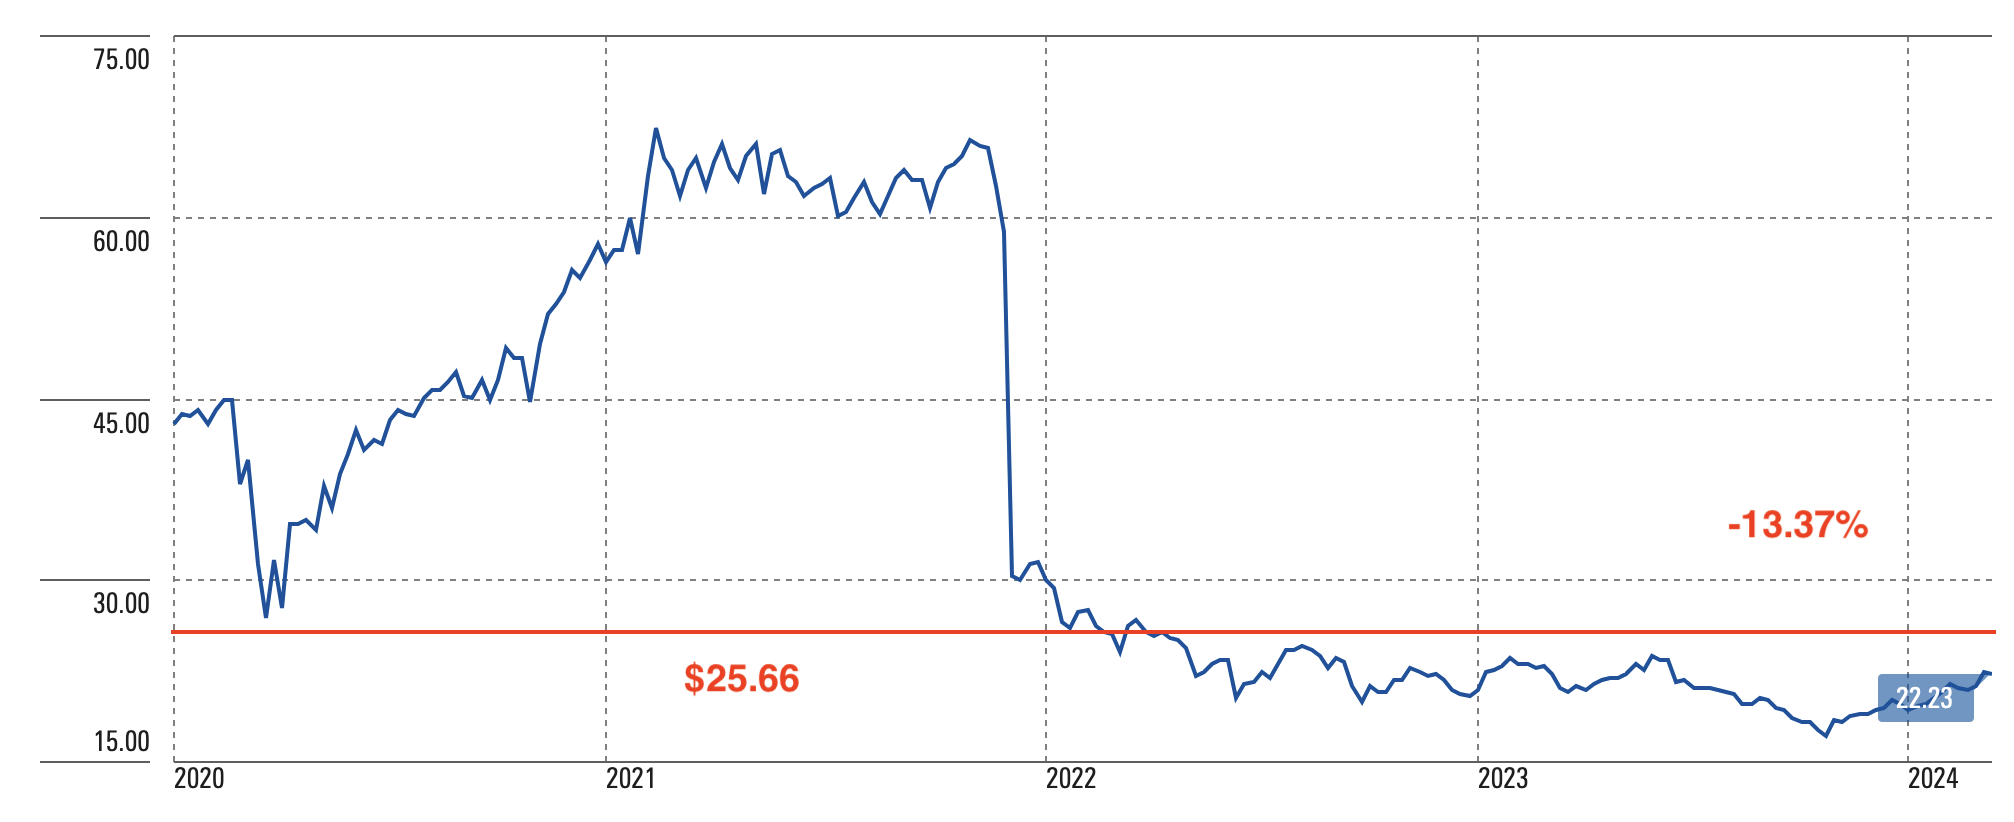
Global X Nasdaq 100 Covered Call
Price Performance (Morningstar, Author)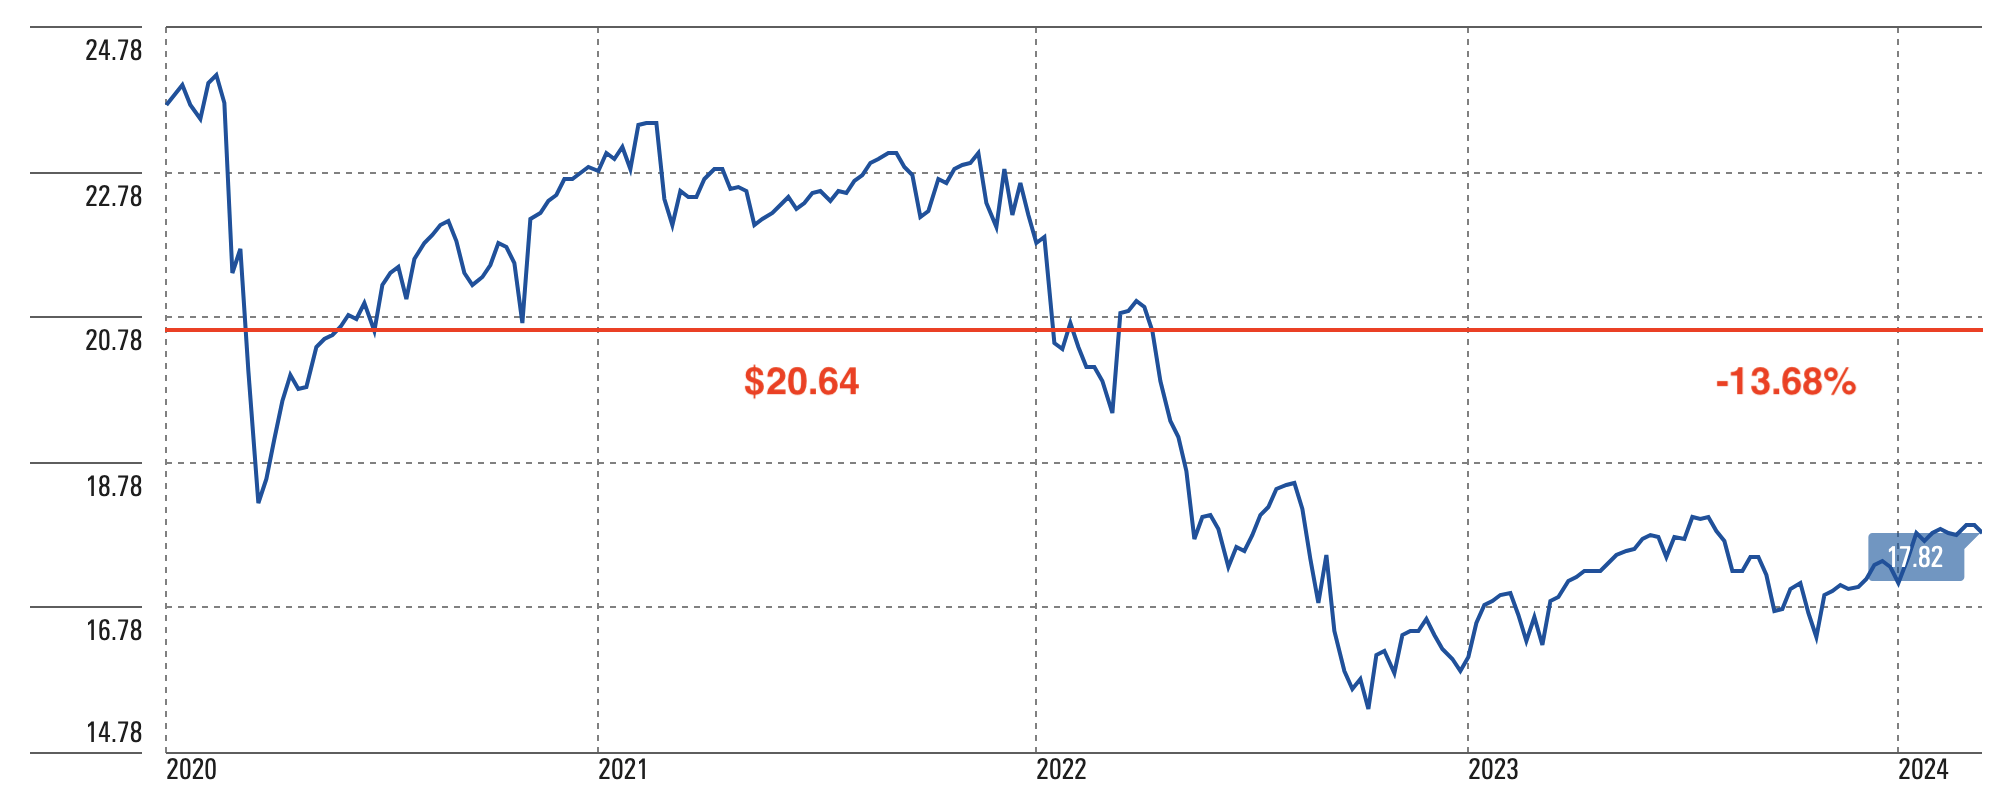
Finally, these last four securities show a loss of more than 20 percent, despite the fact that GOF and PDI enjoy a very good reputation in the market, reflected by the premiums at which they price relative to NAV. CGO is a global equity that has been capable of mighty recoveries in the past, while RYLD is a covered call ETF linked to the Russell 2000 index, which is far from a possible recovery, if it ever happens.
Calamos Global Total Return
Price Performance (Morningstar, Author)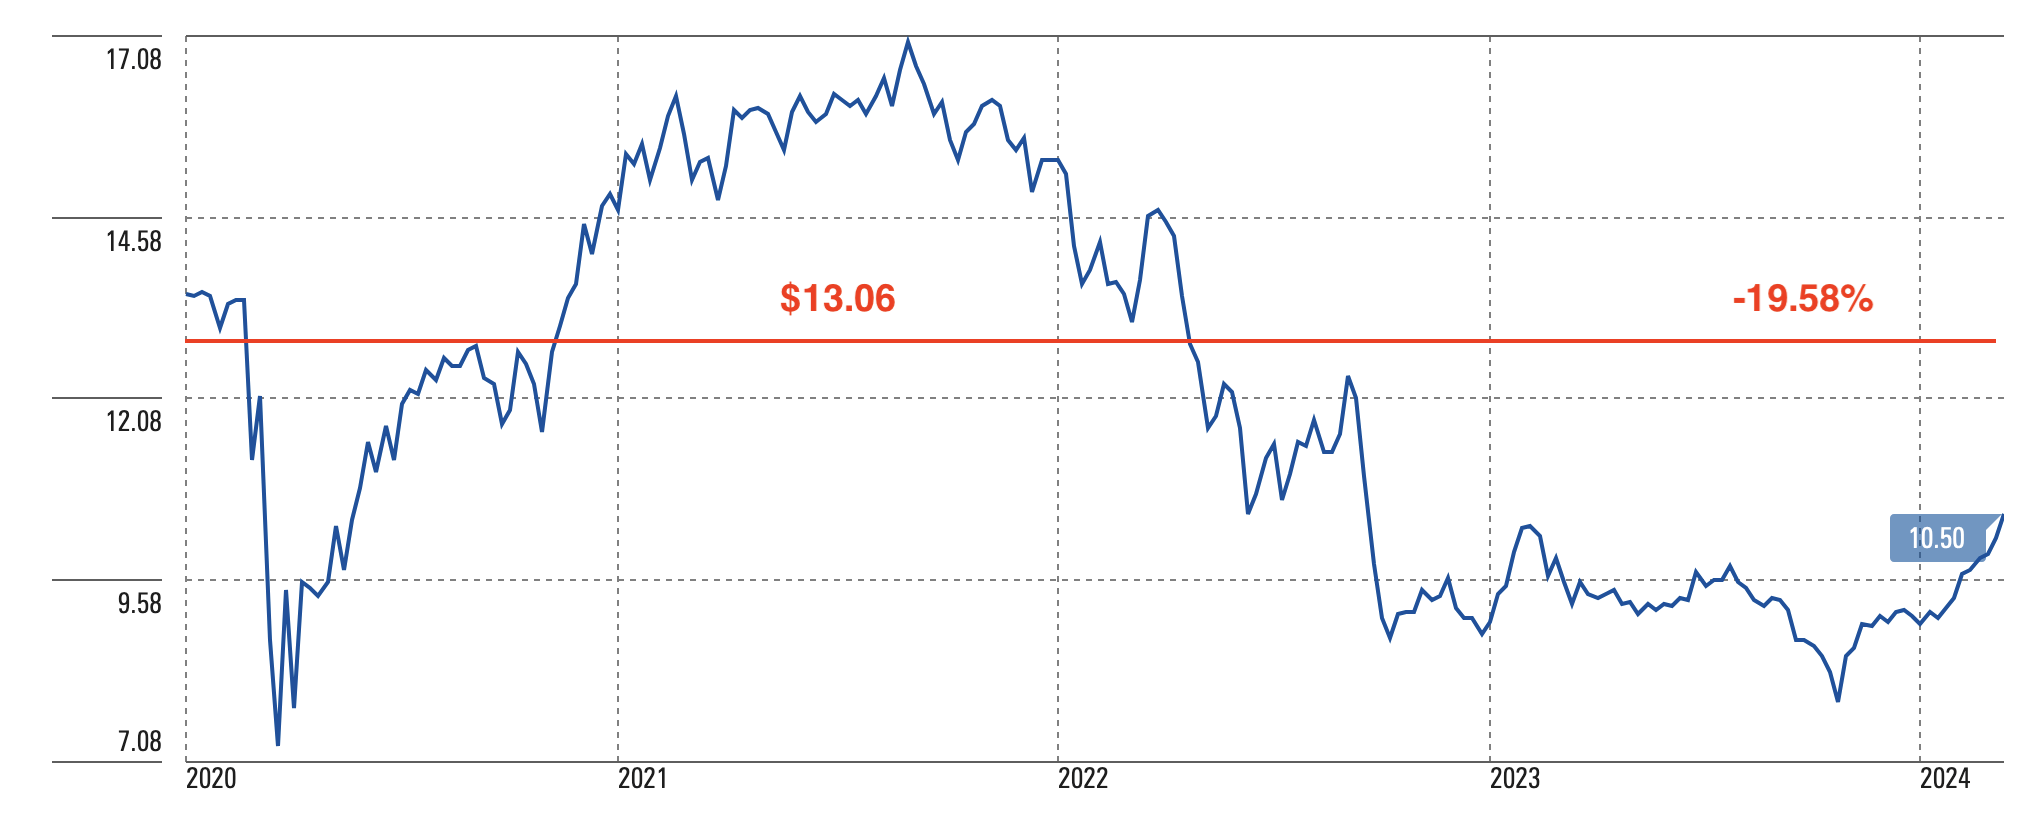
Guggenheim Strategic Opportunities
Price Performance (Morningstar, Author)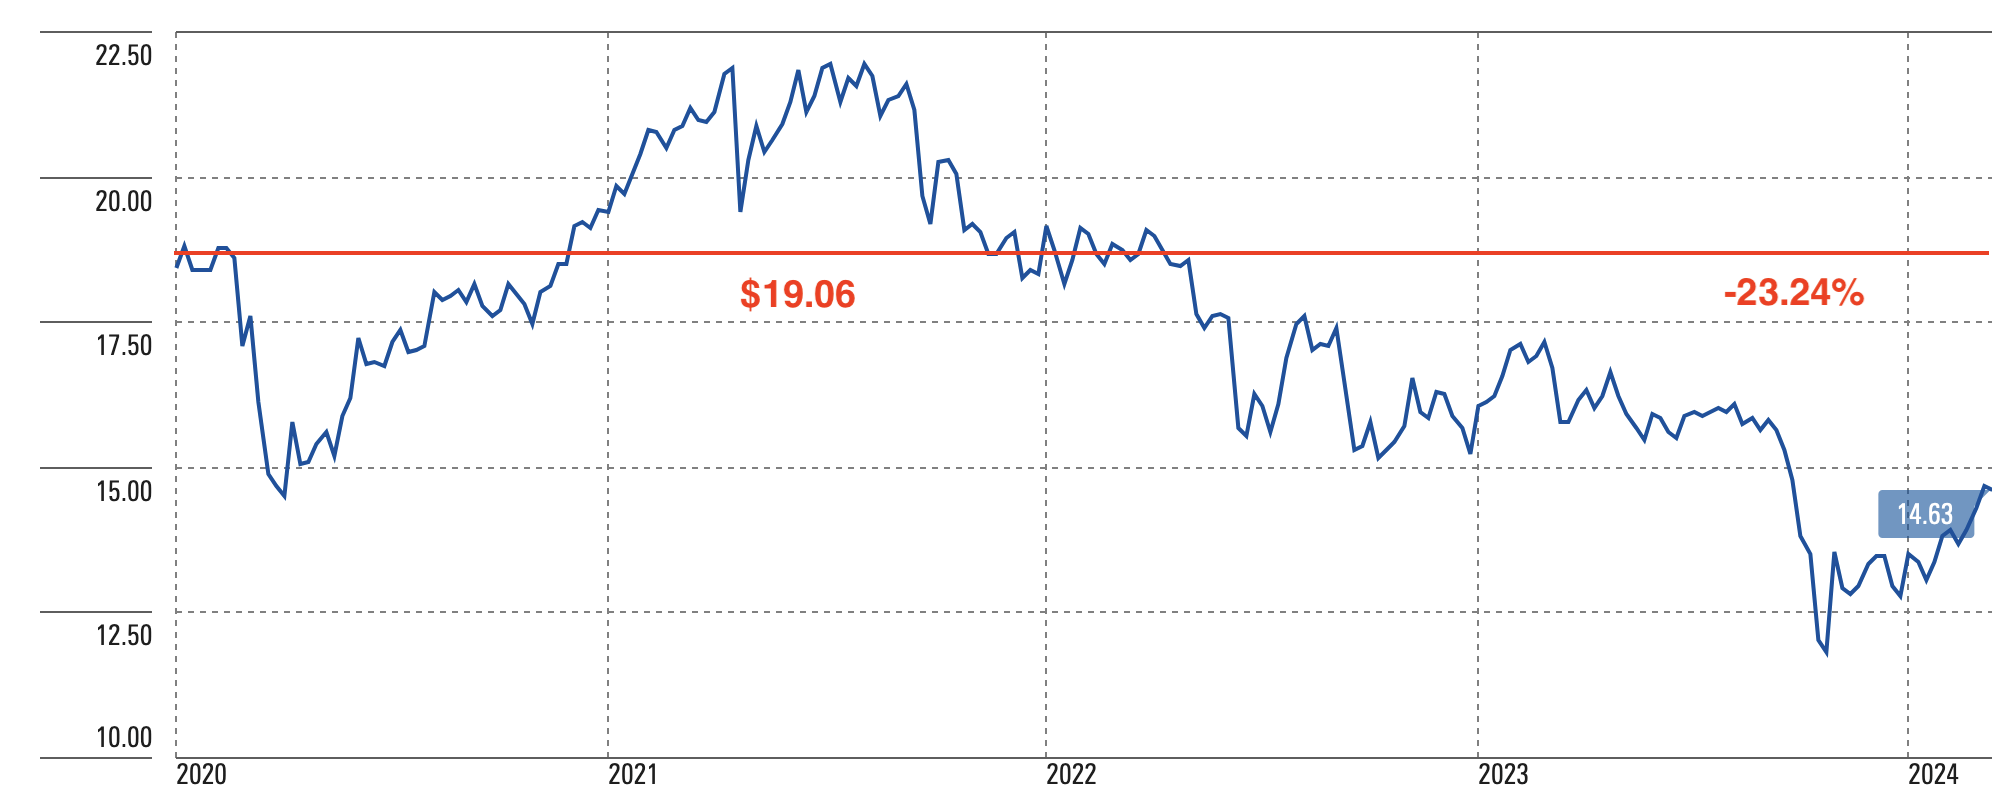
PIMCO Dynamic Income
Price Performance (Morningstar, Author)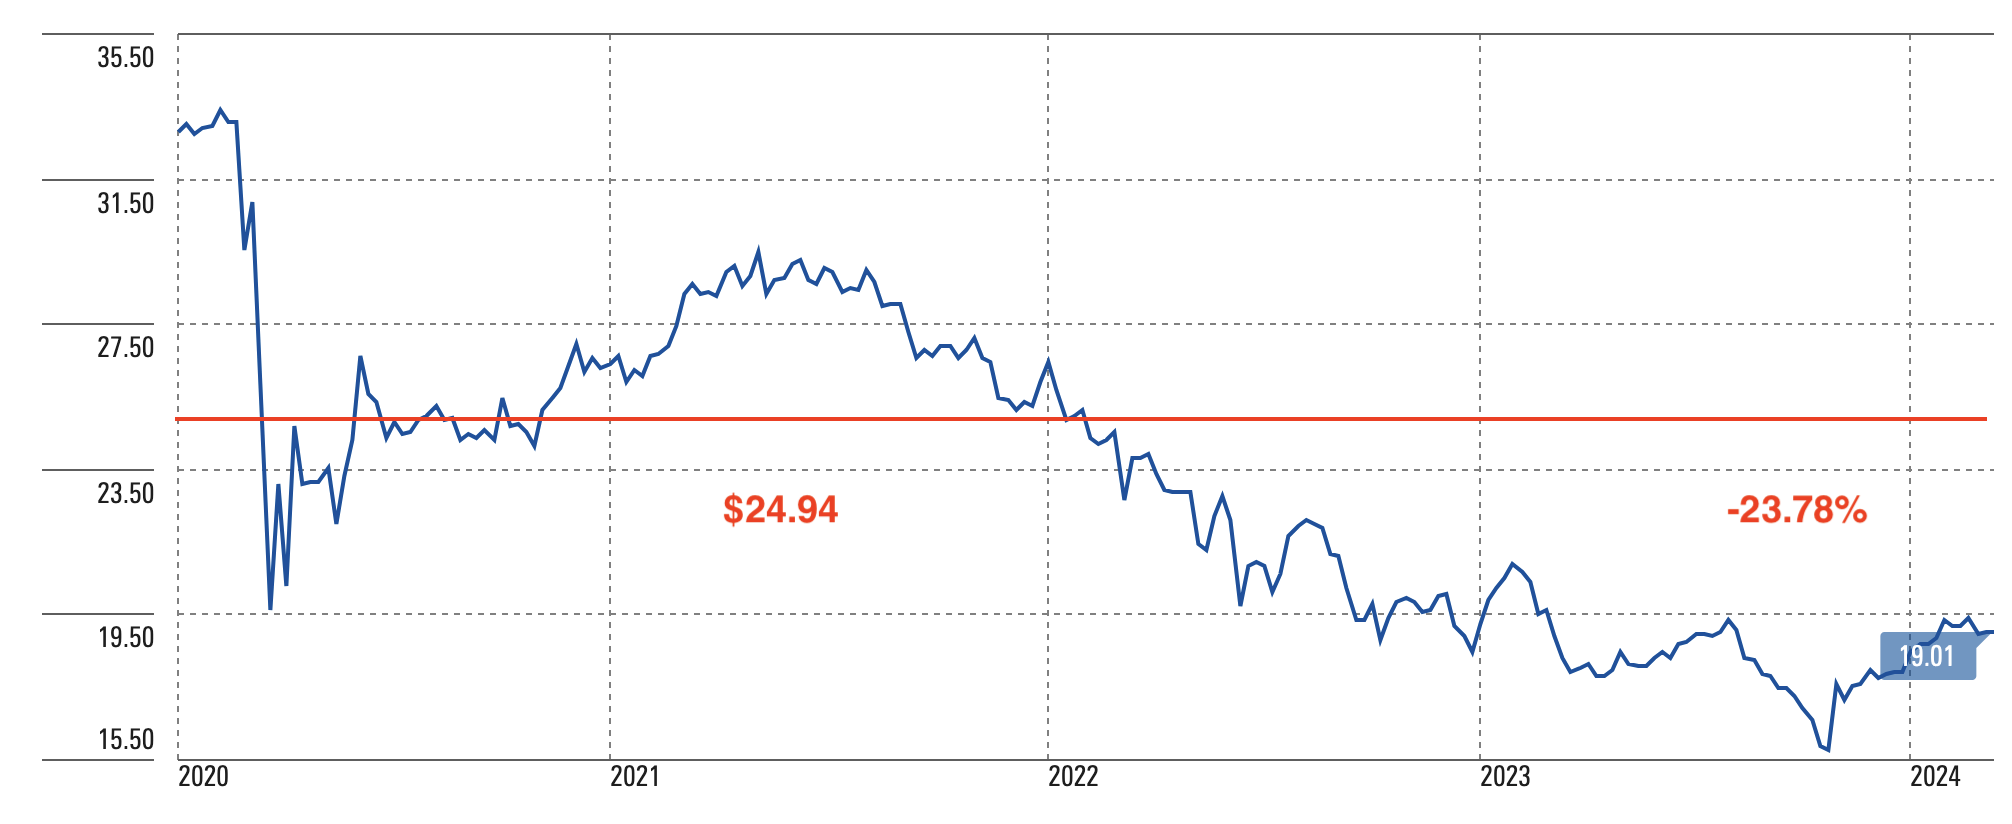
Global X Russell 2000 Covered Call
Price Performance (Morningstar, Author)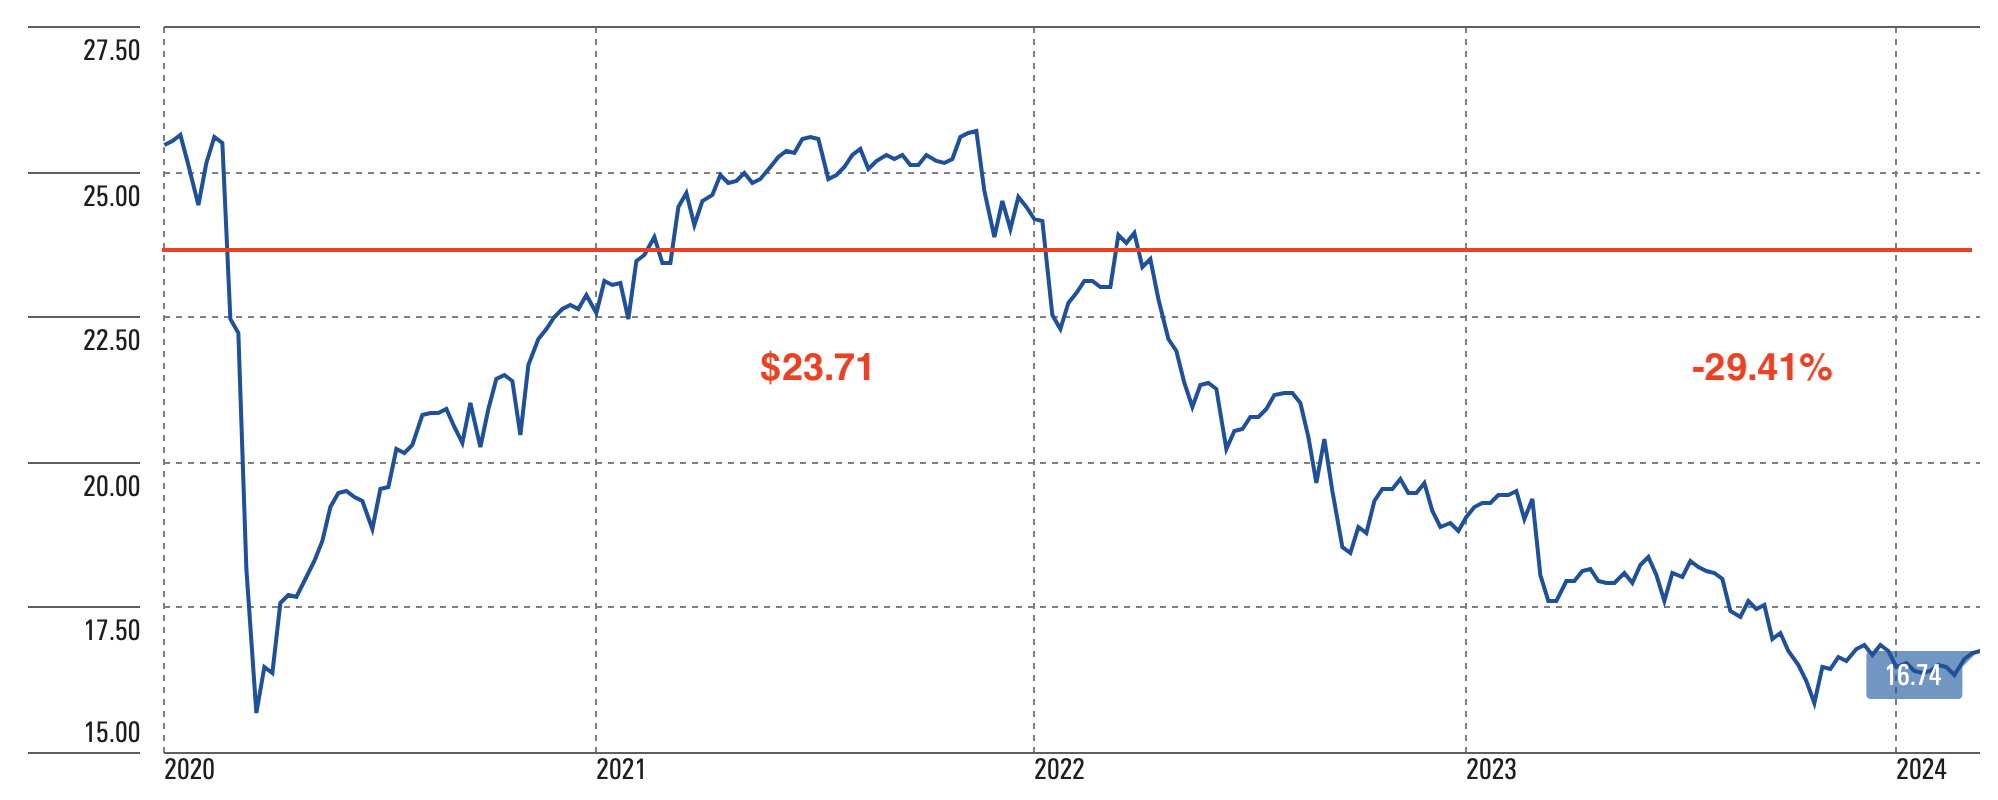
As we have seen, after a rise that lasted a couple of years from the lows of spring 2020, from early 2022 many securities started a downturn that continued until fall 2023. Right now, almost half of my stocks are in positive territory relative to their purchase price, a few others are just below parity while there are eight securities showing a loss of more than 10 percent, with four of them even down more than 20 percent. The portfolio as a whole is currently losing 1.78% after almost reaching parity last week: without these last four stocks it would have been in positive territory long ago, but unfortunately, I have to deal with reality. Dividends and distributions, however, have always flowed regularly (my overall portfolio’s yield this month is 9.47% thanks to the generous coupon from USOI) but the capital loss is still significant, although the weight of the worst-performing stocks is on average less than the other I have.
I should point out that after I have made my purchases, I do not usually rebalance the portfolio, that is, sell or increase portions of my securities in order to set the weight of each asset class or security back to its original state. Once the initial percentages are decided, the weight of securities remains such unless I can average their purchase price downward while rarely averaging it upward. Be that as it may, if I decide to increase my positions, I always try to make purchases according to the criteria described, and in any case never according to the amount of the dividend.
To Put in the Backpack
There are a variety of families in Chianti that have been making wine for centuries. Some as far back as the Middle Ages, such as Antinori, Frescobaldi, Mazzei (the lineage from which Filippo Mazzei, a friend of George Washington, Thomas Jefferson, and John Adams, came) and Ricasoli, winemakers in Brolio as far back as 1141. What can make millions of wine lovers around the world imagine that the products of these companies will continue to satisfy their palates in a week, a month, or a year, if not the solid reputation they enjoy, founded on centuries-old knowledge?
Just as wine lovers have their certainties and their reference brands, which guarantee them a harmony of scents and flavors constant over time, similarly in the field of investments it is possible to find CEFs and ETFs that can combine yield and capital growth, thus creating a virtuous circle based on a dual source of wealth.
Warren Buffett invests in companies with long and positive histories, that is in businesses that have demonstrated an ability to compete and grow within their field: the longer a business has been around, the more confident he is that it can continue to generate positive returns for shareholders.
Personally, I have been trying for a few years to build a virtuous portfolio in this respect, but the skimming off of “false positives” is very slow and requires time, patience, analysis, and comparisons-a learning process that allows one to expand one’s knowledge in light of the new information. Starting in the fall of 2019, I designed my income portfolio with 15 CEFs (later expanded) that at that time had excellent NAV performance since inception. Four years later, I have realized that I will have to adjust my focus, as I have also illustrated in recent articles, while still staying within the framework of high-income vehicles such as BDCs, CEFs, and ETFs.
For Italian law, CEFs and ETFs are instruments considered “non-harmonized” for tax purposes because they are not listed on European stock exchanges and do not comply with EU directives on key investor documentation. Evidently, even in the arid language of tax law, an idea of harmony manages to make its way, although far from Curzio Malaparte’s suavity in describing the gentle Tuscan landscape:
The clouds, streams, rivers, everything that flows through here, everything that reflects the sky, even that silver color that the wind paints the stones and the leaves on the trees as it blows through are the handiwork of some saint or other.” (Curzio Malaparte, Damned Tuscans, 1956)
Postscript: In a December 15, 2021 article, I complained that the charts showing the NAV performance of each fund had disappeared from the CEF section of the Morningstar website. I recently noticed that they have reappeared: just go to the “Chart” menu for a security, select “NAV” as the Data Type, and set the desired time interval, as well as other display modes. It seemed only fair to point this out to all interested users, “orphans,” like me, of the previous version.