CN¥0.15 loss per share (vs CN¥0.036 profit in FY 2022)
Trans-China Automotive Holdings (Catalist:VI2) Full Year 2023 Results
Key Financial Results
-
Revenue: CN¥3.46b (down 14% from FY 2022).
-
Net loss: CN¥91.6m (down from CN¥21.0m profit in FY 2022).
-
CN¥0.15 loss per share (down from CN¥0.036 profit in FY 2022).
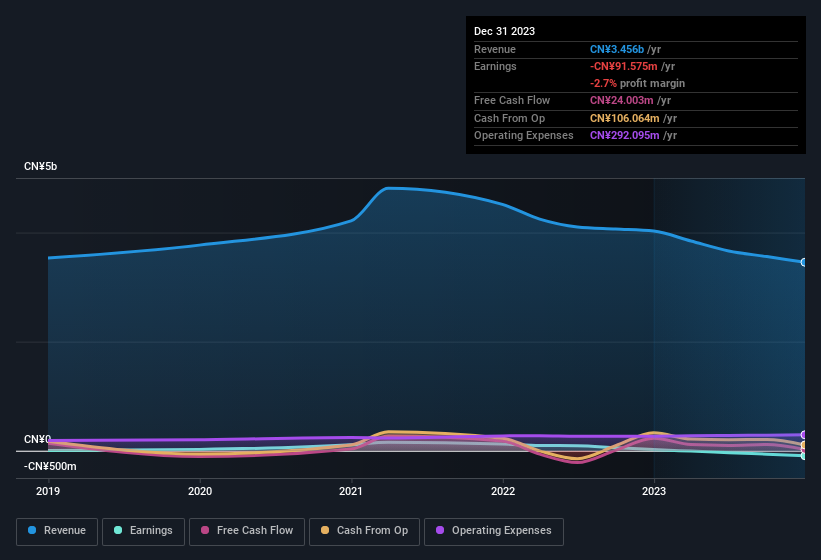
All figures shown in the chart above are for the trailing 12 month (TTM) period
Trans-China Automotive Holdings shares are down 1.2% from a week ago.
Risk Analysis
We don’t want to rain on the parade too much, but we did also find 4 warning signs for Trans-China Automotive Holdings (2 can’t be ignored!) that you need to be mindful of.
Have feedback on this article? Concerned about the content? Get in touch with us directly. Alternatively, email editorial-team (at) simplywallst.com.
This article by Simply Wall St is general in nature. We provide commentary based on historical data and analyst forecasts only using an unbiased methodology and our articles are not intended to be financial advice. It does not constitute a recommendation to buy or sell any stock, and does not take account of your objectives, or your financial situation. We aim to bring you long-term focused analysis driven by fundamental data. Note that our analysis may not factor in the latest price-sensitive company announcements or qualitative material. Simply Wall St has no position in any stocks mentioned.