The $64,000 Question: Can The Stellar Stock Market Run Continue?

MicroStockHub
Despite a solid 2023 and a robust rally into year-end, the S&P 500 (SP500) “SPX” fearlessly climbed the wall of worry, gaining about 10% in Q1. The Fed’s continued pivot toward a more accessible monetary policy, a resilient economy, substantial corporate profits, advances in AI, and other factors have enabled sentiment to remain strong, pushing stocks higher and higher to new ATHs this year.
However, the $64,000 question remains: Can the stellar stock market run continue? Will there be a correction? If so, when and how deep?
When the correction ended in October 2023, and the SPX bottomed around 4,100, it was time to be greedy. However, after a 30% surge in around five months, with the SPX around 5,300 now, it’s time to be cautious again in the near term.
SPX 1-Year Chart
SPX (StockCharts.com | Advanced Financial Charts & Technical Analysis Tools)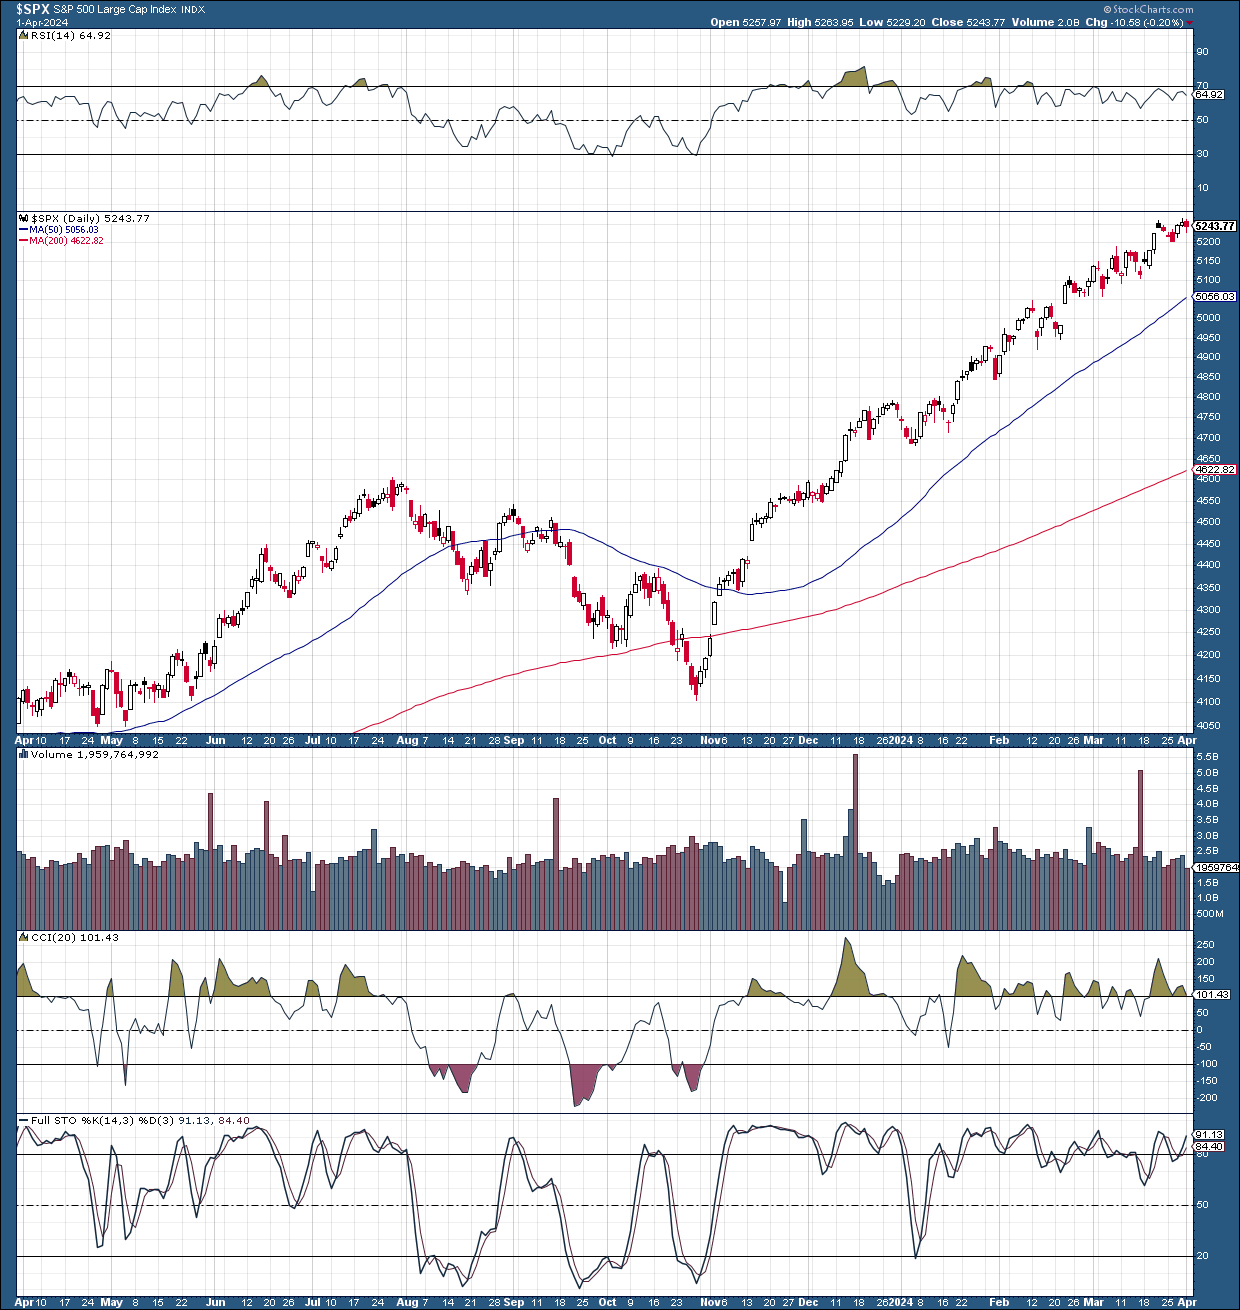
While attempting to time a correction may be a fool’s errand, we may want to exercise increased caution in the near term. Many stocks have appreciated considerably in a relatively short time frame, and the SPX’s technical momentum is decreasing now. The RSI is making lower highs despite the SPX’s continued move higher, increasing the probability of a pullback, rotation, or consolidation phase in the near term.
However, in the intermediate and long term, the technical image remains solid, and the market has excellent fundamentals to support more upside in stocks as we advance. Therefore, despite the possibility for a pullback/correction, there is a high probability the SPX can end 2024 considerably higher, as 5,800-6,000 remains my year-end target range.
In my view, there are several possibilities concerning a possible correction. The SPX could experience a 5% pullback to around 5,000 in a base-case scenario and roughly a 10% correction to the 4,700-4,800 zone in a worse-case outcome.
Timing the market is more challenging than it seems, especially when identifying near-term tops. Therefore, I am only implementing light hedges (mostly covered call dividends or CCDs) until crucial support levels begin breaking down. Initial support is around 5,200, and the critical support zone remains 5,100-5,000.
Earnings Season To Kick Off Soon
Earnings are typically a favorable catalyst for stocks in a bull market, and I look forward to crucial companies reporting in the coming weeks. Still, stocks could dip into earnings, creating buying opportunities before major reports occur. Significant bank earnings kick off around April 12th, just ten days away. The most significant part of the earnings season will arrive around the 22-26th of April when the biggest tech companies will announce their results.
This Week – Crucial Data Ahead
Economic data (Investing.com – Stock Market Quotes & Financial News)
The ISM manufacturing data came in slightly hot on Monday, suggesting inflation may not be as tame as expected. On the other hand, the ISM manufacturing data illustrate that the economy is in better shape than expected and remains highly resilient at this stage.
We will see the ISM non-manufacturing data on Wednesday, which could also come in a bit hot. Moreover, Fed Chair Powell will speak on Wednesday, which could impact market sentiment.
Of course, the critical data point comes Friday, the all-important non-farm payrolls report. We want to see a number in the 100-200K zone. If we see 300K or higher, the market may react negatively, as it would likely push the first rate cut further out.
The First Rate Cut In June Is Still Likely
Rate probabilities (CMEGroup.com)
We’re looking at the first rate cut, likely in June or July. The odds of a cut at or by the July FOMC meeting are around 73%, while the probability of a cut at the June meeting is around 59%. In a worse-case scenario, we could see the first rate cut in September. The odds of a cut at or before the September FOMC meeting are around 90%.
Valuation Check Up
Index valuations (WSJ.com)
Despite the recent run-ups in major averages, stock valuations remain relatively inexpensive, given the economy’s resilience, growth prospects, and the likely shift toward a more accessible monetary policy soon. The SPX’s forward 12-month P/E ratio is about 21.5, suggesting that 2025’s P/E ratio may be below 20 now. Additionally, the forward P/E ratio on the Nasdaq 100 is around 27, and the R2K’s is below 25. This dynamic illustrates that technology, small, and mid-cap stocks remain relatively cheap now.
The Bottom Line
We’ve had a hot start to the year, with the S&P 500 gaining 10%. It may be time for a pullback, consolidation, and rotation phase. Nonetheless, the economy remains highly resilient and is more robust than anticipated in many respects. Moreover, the Fed will likely cut rates soon, providing a favorable backdrop for the economy and for stocks.
We also have many growth areas, including the lucrative AI segment that should expand greatly, increasing profitability and general efficiency for many companies. This dynamic should enable high-quality stocks to move considerably higher in the intermediate and long term despite the possibility of a correction or a pullback. Due to the favorable technical, fundamental, and psychological factors surrounding the economy and the stock market, I’m keeping my S&P 500 year-end target range at 5,800-6,000.