USDCAD Technical Analysis – We are trading between two key levels
Fundamental
Overview
The USD has been generally
under pressure since the benign US CPI report last week as the hawkish
expectations subsided and the market switched its focus from inflation back to
growth. This triggered a positive risk sentiment which is generally negative
for the greenback.
The CAD,
on the other hand, got pressured from the weaker than expected Canadian CPI
figures which raised the chances of a rate cut in June (although it remains
basically a coinflip). If the positive risk sentiment were to continue though,
we might see the CAD gaining ground against the USD anyway.
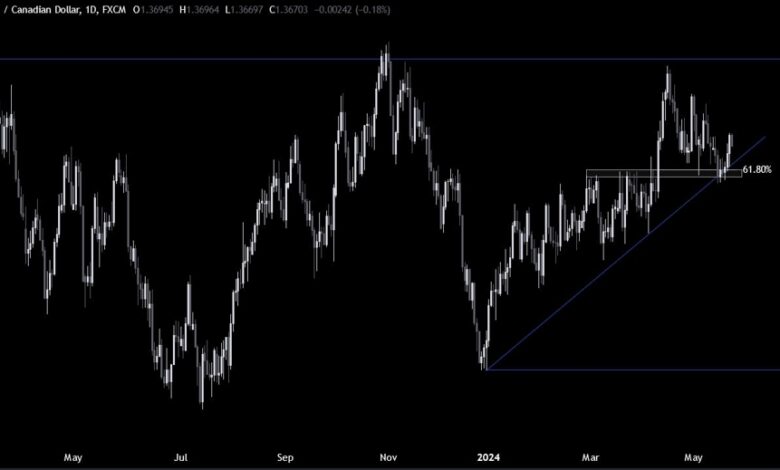
USDCAD Technical
Analysis – Daily Timeframe
USDCAD Daily
On the daily chart, we can
see that USDCAD bounced from the key support zone
around the 1.36 handle where we had the confluence
of the trendline
and the 61.8% Fibonacci retracement level and extended the rally into the 1.37 handle following the weaker
Canadian CPI report.
The
buyers will need the price to break above the 1.37 handle to start targeting
the 1.38 handle next. The sellers, on the
other hand, will want to see the price breaking below the trendline and especially
the 1.36 support to gain more conviction and increase the bearish bets into the
1.34 handle.
USDCAD Technical
Analysis – 4 hour Timeframe
USDCAD 4 hour
On the 4 hour chart, we can
see that the sellers stepped in around the 1.37 handle where they had also the
confluence of the downward trendline and the 61.8% Fibonacci retracement level.
As previously mentioned, they will need the price to fall below the 1.36
support to increase the bearish bets into new lows.
The
buyers, on the other hand, will want to see the price breaking above the
trendline to invalidate the bearish setup and increase the bullish bets into
the 1.38 handle next.
USDCAD Technical
Analysis – 1 hour Timeframe
USDCAD 1 hour
On the 1 hour
chart, we can see that we have a good support around the 1.3650 level where we
can find the confluence of the upward minor trendline and the 61.8% Fibonacci retracement
level.
This is where we
can expect the buyers to step in again to position for a break above the
downward trendline with a better risk to reward setup. The sellers, on the
other hand, might want to pile in on a break lower to increase the bearish bets
in expectations of a breakout to the downside.
Upcoming
Catalysts
Today we get the latest US PMIs and Jobless Claims figures.
Tomorrow, we conclude with the Canadian Retail Sales data.