Economic Outlook | Statement on Monetary Policy – August 2023

Global growth is forecast to remain well below its historical average over the next two years, as the
lagged effects of monetary policy tightening continue to weigh on demand. The central forecast for growth
in Australias major trading partners has been revised down, partly because Chinas post-COVID-19 recovery has been weaker than expected (see Chapter 1: The
International Environment).
Growth in economic activity in Australia is forecast to remain subdued over the rest of the year as
cost-of-living pressures and the rise in interest rates continue to weigh on domestic demand
(Table 5.1). It is expected that growth will then increase gradually over the remainder of the
forecast period, supported by an easing in these headwinds and a pick-up in household wealth. Labour
market conditions have been very tight but these are forecast to ease, with an increase in both the
unemployment and underemployment rate over coming years as a result of subdued economic growth. Inflation
is forecast to decline to be around 3¼ per cent by the end of 2024 and to be back within the
2–3 per cent target range in late 2025. Goods prices have
accounted for most of the decline in inflation so far and this is expected to continue in the near term
as the resolution of supply disruptions flows through to prices paid by consumers. By contrast,
electricity costs will increase, and high services inflation is forecast to persist. There are several
key domestic uncertainties that may result in different outcomes than forecast. These are discussed at
the end of this chapter.
| Year-ended | ||||||
|---|---|---|---|---|---|---|
| June 2023 |
Dec 2023 |
June 2024 |
Dec 2024 |
June 2025 |
Dec 2025 |
|
| GDP growth | 1½ | 1 | 1¼ | 1¾ | 2 | 2¼ |
| (previous) | (1¾) | (1¼) | (1½) | (1¾) | (2) | (n/a) |
| Unemployment rate(b) | 3.6 | 4 | 4¼ | 4½ | 4½ | 4½ |
| (previous) | (3½) | (4) | (4¼) | (4½) | (4½) | (n/a) |
| CPI inflation | 6.0 | 4¼ | 3½ | 3¼ | 3 | 2¾ |
| (previous) | (6¼) | (4½) | (3½) | (3¼) | (3) | (n/a) |
| Trimmed mean inflation | 5.9 | 4 | 3¼ | 3 | 3 | 2¾ |
| (previous) | (6) | (4) | (3¼) | (3) | (3) | (n/a) |
| Year-average | ||||||
| 2022/23 | 2023 | 2023/24 | 2024 | 2024/25 | 2025 | |
| GDP growth | 3 | 1½ | 1 | 1¼ | 1¾ | 2 |
| (previous) | (3¼) | (1¾) | (1¼) | (1½) | (1¾) | (n/a) |
|
(a) Forecasts finalised 2 August. The forecasts are conditioned on a path for the
Sources: ABS; RBA.
|
||||||
The forecasts are based on some technical assumptions. The path for the cash rate reflects expectations
derived from surveys of professional economists and financial market pricing, with an assumed peak in the
cash rate of around 4¼ per cent by the end of 2023 before declining to 3¼ per cent by
the end of 2025. This compares with an assumed peak in the cash rate of 3¾ per cent in the May
Statement. The exchange rate is assumed to be unchanged at its current level, which is
broadly unchanged relative to its level at the May Statement on a trade-weighted basis.
Petrol prices are assumed to be broadly unchanged around their June quarter average. The level of the
population has been revised higher, reflecting stronger-than-expected growth in recent quarters; over the
next couple of years, year-ended population growth is expected to decline from its recent rate of around
2 per cent back to its pre-pandemic average of around 1.5 per cent.
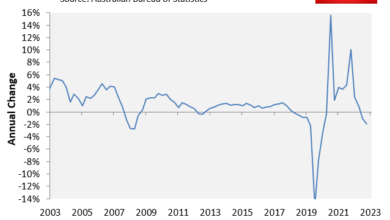
Inflation in Australia is easing
Consumer price inflation in Australia continued to decline in the June quarter but remains high and
broadly based (Graph 5.1). While goods price pressures have continued to ease, services inflation
remains persistently high, as has been the case overseas. The outlook for headline and underlying
inflation remains similar to a few months ago. Recent evidence of stronger growth in the measure of unit
labour costs (partly driven by weaker productivity) and higher rent inflation have largely offset the
effects of the small downgrades to the forecasts for economic activity and weaker-than-expected goods
price inflation in the June quarter. Inflation is forecast to decline to around 3¼ per cent by
the end of 2024, and to be within the target range at 2¾ per cent by the end of 2025.
Graph 5.1

As has been the case for some time, energy prices are forecast to add significantly to inflationary
pressures over the coming year. The average change in household and business electricity prices remains
uncertain; however, the impact of increases in electricity prices on the CPI will be partially offset by
government rebates under the Australian Governments Energy Price Relief Plan and various state
government initiatives. Electricity prices are forecast to add around ¼ percentage point to headline
inflation over the 2023/24 financial year, similar to the forecast
three months ago.
Goods price inflation is forecast to moderate further in the period ahead as the easing in global upstream
costs continues to be passed through to final prices amid slowing growth in demand. This is consistent
with the experience in other advanced economies, albeit lagged. Firms in the Banks liaison program
have reported significant supply chain improvements and easing in some non-labour input cost pressures,
most notably for international freight and some imported goods. Domestic cost pressures – such as
energy, labour costs and logistics – remain a source of upward pressure in firms pricing
decisions, though these are expected to ease later in the forecast period.
Services inflation is forecast to remain high in coming quarters amid rising labour costs and a still-high
level of demand, before easing gradually as demand moderates and generates spare capacity. Rent inflation
is forecast to increase further over the period ahead as rental vacancy rates remain low, and as housing
supply responds with a lag to population growth.
Underlying inflation is forecast to decline over coming years to be around 3 per cent by the end
of 2024 (Graph 5.2). The decline in inflation over the remainder of 2023 is expected to be driven by
the resolution of supply disruptions and slower growth in demand (Graph 5.3). Ongoing tightness in
the labour market and energy price increases are expected to keep domestic price pressures elevated in
the near term before they start to ease later in the forecast period. There remains a high degree of
uncertainty around the speed and extent of the decline in inflation expected in the period ahead. On the
one hand, lower goods price inflation from the resolution of supply chain issues could come through
sooner and swifter than anticipated. On the other hand, domestic price pressures may be stronger and more
persistent than expected. These risks are discussed further in the section on Key domestic
uncertainties below.
Graph 5.2

Graph 5.3

Economic growth is expected to be weak in the period ahead
GDP growth is forecast to remain subdued over the rest of 2023, with GDP per capita declining over this
period (Graph 5.4). The soft near-term outlook reflects subdued growth in household consumption as
higher interest rates and cost-of-living pressures weigh on real disposable income. However, higher
household net wealth – reflecting the recent increase in housing prices – is forecast to
provide some support. Ongoing capacity constraints and weak demand for new housing are forecast to weigh
on dwelling investment until mid-2024.
Graph 5.4

GDP growth is forecast to increase gradually from early next year, supported by household consumption and
public demand. Household consumption growth is forecast to increase to around its pre-pandemic average,
supported by a recovery in real income growth and a pick-up in household wealth. Exports will continue to
be supported by the rebound in tourism and solid growth in education-related travel.
Consumption growth is forecast to remain subdued in the near term
Household consumption growth is forecast to remain subdued over coming quarters (Graph 5.5). This
reflects weak growth in real disposable incomes as the strong growth in labour incomes is being more than
offset by high consumer price inflation, the earlier tightening in monetary policy and higher tax
payable. Consumption growth is forecast to pick up to around its pre-pandemic average by late 2024 and
remain around that rate over 2025. The increase in consumption growth is expected to be supported by a
fading in the current headwinds to real income growth as inflation declines, interest rates are assumed
to be past their peak and growth in household wealth picks up. The Stage 3 tax cuts will also
support income and consumption from mid-2024.
The household saving ratio is forecast to continue to decline over the next year or so, before increasing
gradually from mid-2024.
Graph 5.5

The outlook for private investment has softened but remains positive
Labour shortages are expected to continue weighing on the pace of residential and non-residential
construction throughout the rest of 2023. Shortages of finishing trades – such as internal fitters,
tilers and painters – have been a significant constraint on firms ability to work through the
large existing pipeline of residential construction. Some firms have been experiencing cash flow issues
and insolvencies have risen in the construction sector, which may result in further delays to project
timelines.
Further out, capacity constraints are anticipated to ease, and firms will continue to work through the
existing pipeline of residential and non-residential construction work to be done. Although demand for
new housing has been weak, strong population growth and higher housing prices are expected to support a
recovery in demand and residential construction activity over coming years. While strong inward migration
and high rental yields will support demand for new dwellings, higher density housing supply typically
responds with a significant lag due to long planning and construction lead times. After gaining planning
approvals and pre-sales, the average apartment building takes more than two years to build.
Non-mining machinery and equipment investment is forecast to remain at an elevated level in the near term,
consistent with information from the ABS Capital Expenditure Survey, before easing further out. Mining
investment is forecast to grow over the rest of 2023, before easing slightly as work on expansionary iron
ore and oil and gas projects winds down. The majority of mining investment currently underway remains
sustaining in nature and is intended to replace ageing infrastructure.
Public demand is expected to grow
Public consumption is forecast to increase modestly over the remainder of the year, with lower
pandemic-related spending offset by temporary expenditures on electricity rebates. Further out, the
expansion in public consumption will be supported by public spending programs such as the National
Disability Insurance Scheme and aged care.
The existing pipeline of public infrastructure work is anticipated to support a high level of public
capital expenditures for several years, although the speed of the rollout will continue to be affected by
capacity constraints in the construction sector in the near term.
Education and travel will drive growth in exports
Export volumes are forecast to continue to grow modestly over coming years, driven by services exports.
The number of student visa holders in Australia is around its pre-pandemic level and is expected to
continue growing strongly, consistent with pre-pandemic trends. Overseas tourist arrivals are around
80 per cent of their pre-pandemic levels and are also expected to continue growing strongly as
airline capacity returns. Resource exports are expected to grow slowly, supported by a recovery in coal
exports in the near term and small expansionary iron ore projects further out in the forecast period. By
contrast, rural export volumes are forecast to decline as growing conditions deteriorate following an
exceptional couple of years. Warmer and drier conditions are expected over the latter part of the year
amid an increased likelihood of an El Niño event, which is generally associated with lower-than-average
rainfall across the eastern seaboard of Australia.
The terms of trade are expected to fall in the June quarter, driven by a sharp decline in coal prices
(Graph 5.6). The terms of trade will then continue to decline over the remainder of the forecast
period as commodity prices fall, though this will be partly offset by a gradual easing in import prices
as supply chains improve.
Graph 5.6

The unemployment rate is forecast to increase as economic growth slows
Employment growth is forecast to moderate over the remainder of this year as a result of a period of
subdued economic growth and an associated softening of labour demand (Graph 5.7). In addition, hours
worked have been a key margin of adjustment to labour demand and have grown by more than employment since
the start of the pandemic; average hours worked are forecast to decline from now onwards as part of the
expected labour market downturn. Participation in the labour force is expected to be sustained around
historically high levels over the forecast period. The effect of the cyclical slowing in the labour
market is expected to be partly offset by the continuing of the current trends of higher participation by
female and older workers.
Graph 5.7

Labour market spare capacity remained around multi-decade lows in the June quarter, though a broad range
of measures suggest the labour market is not as tight as it was in late 2022. Labour underutilisation (as
measured by the unemployment rate and by people working fewer hours than they want) is expected to
gradually increase as labour demand moderates while the labour force continues to grow; population growth
supports growth in labour supply while also adding to aggregate demand in the economy. That said, the
unemployment rate is expected to remain below pre-pandemic levels throughout the forecast period
(Graph 5.8).
Graph 5.8

Wages growth is expected to increase further
Timely indicators suggest that wages growth was steady in the June quarter ahead of the implementation of
the Fair Work Commissions (FWC) award and minimum wage changes in July. Firms in the Banks
liaison program report that their current wages growth and year-ahead expectations were steady at around
4 per cent in the June quarter. Market economists and unions expect wages growth to be 3½ to
4 per cent over the year ahead, before moderating over 2024/25.
Year-ended growth in the Wage Price Index (WPI) – which measures changes in base wage rates for a
given quantity and quality of labour – is forecast to be 4 per cent in the second half of
2023, before declining gradually to around 3½ per cent by the end of 2025 (Graph 5.9). The
near-term outlook is slightly stronger than a few months ago. Developments in government wage policies in
several states, the annual minimum and award wage decision by the FWC and the 15 per cent wage
increase for aged care workers will support wages growth over the rest of the year. WPI growth is then
forecast to ease at a gradual pace over 2024 and 2025 as spare capacity in the labour market increases
and inflation declines. Inertia in the wage-setting process and some lagged catch-up in real wages mean
the decline in wages growth is forecast to be slower than the decline in inflation (Graph 5.10).
Graph 5.9

Graph 5.10

Broad measures of labour income are expected to grow at a faster rate than the WPI over the first part of
the forecast period, as employers use bonuses, allowances and other non-base wage payments to retain or
attract staff. These broader measures imply less of a decline in real wages than suggested by the WPI
measure. As labour market conditions ease, the gap between growth in the WPI and broader labour cost
measures is forecast to close.
Recent labour productivity outcomes have remained weak. Together with solid growth in average earnings in
recent quarters, this has seen year-ended growth in unit labour costs reach its highest level since 1990
(excluding pandemic-impacted outcomes in 2021). The forecasts for labour income remain consistent with
the inflation target, provided productivity growth returns to its pre-pandemic trend.
Key domestic uncertainties
The outlook for China is uncertain
Chinas uneven recovery from COVID-19 restrictions has created
uncertainty around the outlook for demand for bulk commodities and, in turn, the prices of
Australias key exports and terms of trade. Demand for residential property in China has weakened
significantly. This could lead to an even more prolonged downturn in real estate investment and lower
steel demand. By contrast, policy measures to stimulate the property sector, if broad in scale and
impact, could increase the prices of bulk commodities in anticipation of stronger steel demand.
Consumer confidence in China remains subdued and heightened economic uncertainty could lead to enduring
incentives for households to prefer saving over discretionary consumption. If consumption growth settles
at a lower trend, this poses additional downside risks to Australias exports to China, including
for education and tourism services as well as consumer goods. Moreover, if Chinas overall growth
settles at a lower rate than expected, this could further weigh on Australias exports through its
effect on the rate of economic growth in Australias major trading partners in the east Asian
region.
The outlook for household consumption is subject to competing forces
The outlook for household consumption remains a key uncertainty for domestic activity. The stronger
outlook for wealth could lead to a larger turnaround in household consumption growth than currently
expected, including via increased housing turnover and increased ability to obtain credit. In addition,
many households built up liquid savings buffers during the pandemic that they can draw upon in the
current environment; spending could be stronger than anticipated if households are willing to spend more
from these savings than expected. This would be reflected in a larger fall in the household savings
ratio. The resilience of the labour market to the slowdown in domestic activity could, if sustained,
contribute to stronger-than-expected outcomes for household incomes and consumption. The realisation of
these stronger outcomes would result in domestic inflationary pressures easing by less than expected.
Weakness in household consumption could persist for longer than expected if weak real disposable income
growth has a larger-than-expected effect, particularly on low-income households that typically have lower
savings buffers. Many households are well placed to absorb higher interest rate costs without significant
adjustments to spending. However, there is a risk that households, especially those with low savings
buffers and high debt relative to incomes, will adjust by more than expected in response to higher
interest rates. Higher interest rates could also encourage households to save more than expected, which
would affect consumption.
Inflation could be more persistent than expected
Underlying inflation is expected to take a couple of years to return to the inflation target range.
However, it is possible that the easing in inflation takes longer than this. Services inflation is
expected to remain elevated over the forecast period – taking signal from the persistence being
experienced overseas – but there is a risk that it remains stubbornly higher than forecast. In a
high inflation environment, it is easier for firms to increase prices; people also tend to pay closer
attention to changes in costs and prices than when inflation is low, and so may come to expect further
large price increases. While margins outside of the mining sector have been broadly stable in recent
years, firms may expand their margins as costs ease if demand remains sufficiently strong. Alternatively,
there could be stronger feedback between wages and prices. Large increases to minimum and award wages and
the lifting or removal of wage caps by state governments could also have greater spillover effects on the
wages of other workers than currently expected, especially if they become a benchmark for wage
negotiations more broadly. In these events, inflation would be persistently higher throughout the
forecast period, which increases the risk that inflation expectations become de-anchored.
Inflation could also be more persistent if productivity growth does not pick up, which would make the
current outlook for nominal wages more inflationary than expected. The forecasts include an expectation
that productivity growth increases to the rate recorded in the years preceding the pandemic. Productivity
growth since the beginning of the pandemic has been weaker than this – in fact, measured
productivity does not appear to have increased at all since 2019 – although the pandemic has made
it difficult to discern underlying trends.
Rent inflation could also be higher and more persistent than expected. Strong population growth is
occurring at a time when the rental market is already very tight and it will take time for supply to
respond. Higher rents are likely to encourage the average number of people living in each dwelling to
increase, which would be a reversal of the decline that occurred during the pandemic as people sought
more space. Conversely, further reductions in household size would put further pressure on the rental
market through higher prices and lower vacancy rates.
Goods prices could decline significantly
The inflation forecasts assume that goods prices stabilise at a high level rather than decline over coming
years. Supply chain conditions are back around pre-pandemic norms and goods inflation has eased in most
advanced economies. Large or widespread declines in goods prices would moderate inflation outcomes by
more than currently expected. One way this could occur is if the simultaneous tightening of monetary
policy across many economies affects demand by more than the sum of individual-economy effects would
imply. To give a sense of the magnitude of this risk, if prices for consumer durables reversed one-third
of the price increases recorded since the onset of the pandemic, year-ended headline inflation would be
around ½ percentage point lower than the current forecast. This would mean that headline inflation
would be around the middle of the inflation target range in 2024, instead of being above it.