Interactive Brokers Group Stock: Riding The Tide Alongside Its Insiders (NASDAQ:IBKR)


Stock photo and footage
Investment Thesis
Company Overview
Interactive Brokers (NASDAQ:IBKR), initiated trading in 1977 on the floor of the American Stock Exchange with headquarters in Greenwich, Connecticut, is a global automated electronic broker facilitating trading with a specialty in routing orders in stocks, options, futures, foreign exchange instruments, bonds, mutual funds, ETFs and precious metals on 150 electronic exchanges in 34 countries and 27 currencies. The company custodies and services clients’ accounts for hedge funds, mutual funds, ETFs, registered investment advisors, proprietary trading groups, introducing brokers, and individual investors.
Strengths and Weaknesses
Being in the business of moving mark-to-market financial products around the globe, Interactive Brokers’ assets are highly liquid. Its portfolio is consolidated worldwide and marked to market daily, with the results posted on its website. The company has equity capital of $14.1 billion as of its latest report, total assets of $120.6 billion with $448.2 billion of ending client equity. The ending client equity currently is 35% higher YoY and 6% higher MoM as of March 1st, 2024. Over half of the client funds are in Treasury securities maturing within 3 months, most likely. It has almost no debt with an “A-/Outlook Stable” rating by Standard & Poor’s.
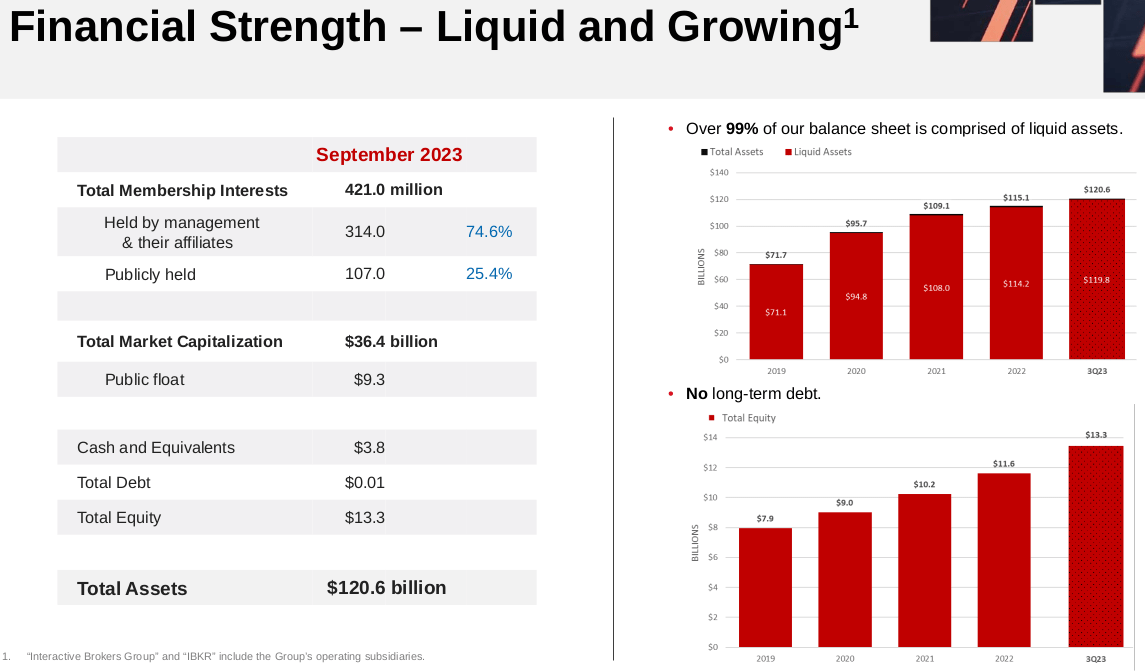
Interactive Brokers: Financial Strength (Company Q4 2023 Presentation )
IB’s trading platform is based on its proprietary technology built in-house, with over 100 order types and algorithms with API solutions. It also offers desktop and mobile platforms with professional quality accessible to everyone. Such a technological culture including automation is so deep-rooted in the company that the majority of its senior management is software engineers. This gives it the advantage of low internal cost and real-time risk management. It passes on the cost savings to its customers and touts it as one of its largest competitive advantages.

Interactive Brokers: Cost Comparison with Peers (Company Q4 2023 Presentation )
The fast growth of its client accounts shows low-cost appeal is working. The number of client accounts has grown to 5x where it was in Q3 2018, and the client equity has doubled during the same time. The difference in these two growth rates was due to the fact that small accounts made up its latest growth. It has 68% of its clients from Individuals, but it also shows the broader appeal of IB’s platform.

Interactive Brokers: Client Accounts Growth (Company Q4 2023 Presentation )
Low-cost trading attracted more inflow of clients and their capital, resulting in better revenue from both commission and net interest income. The company’s number of “All Customers”, referring to customers of all kinds, increased YoY by 67% in 2020 and again by 46% in 2021. The commissions for ’20 grew 57% over the previous year and for ’21 grew 21%. With its All Customers grew 3% in 2022 and again 12% in 2023, its commission revenue growth has been flat. This close relationship shows customer expansion results in direct commission growth, which is more than half of its revenue on average. The other significant part of the revenue is Net Interest Income, which is at least as big of a contribution to revenue as commissions, if not greater. Net interest income grew by 45% in ’22 and 67% in ’23, contributing to 64% of revenue last year.
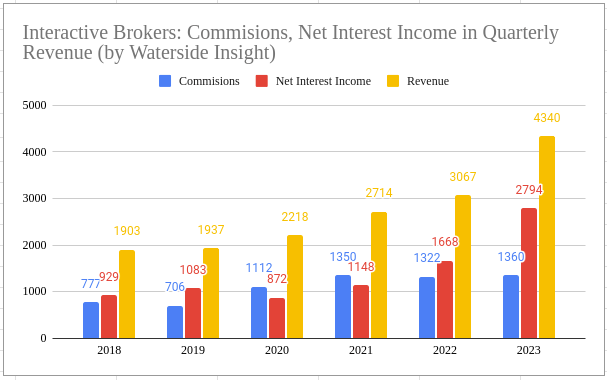
Interactive Brokers: Commissions and Net Interest Income in Revenue (Calculated and charted by Waterside Insight with data from company)
The growth of average interest-bearing assets was about 9-10% each year in ’22 and ’23. However, the growth of its net interest income as a percentage yield from such asset was much faster, doubling in ’23 compared to ’21. According to its 10K for 2023, the net interest income on customer cash and margin loan balance increased significantly YoY because the average FFER (“Federal Funds Effective Rate”) was raised from 1.68% to 5.03%.
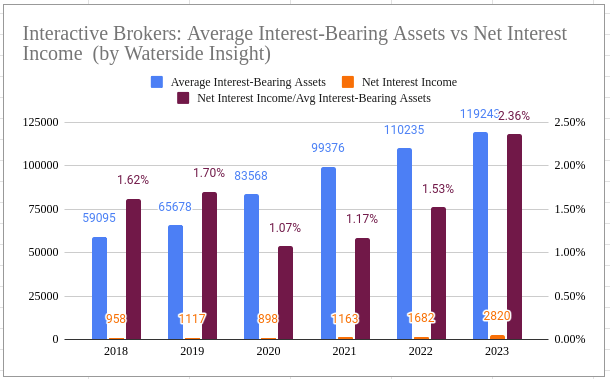
Interactive Brokers: Interest-Bearing Assets vs Net Interest Income (Calculated and charted by Waterside Insight with data from company)
Combining robust top-line growth and relatively low operating expenses resulted in a fast increase in operating income, which was more than 3x of where it was in 2022.

Interactive Brokers: Operating Expenses vs Operating Income (Calculated and charted by Waterside Insight with data from company)
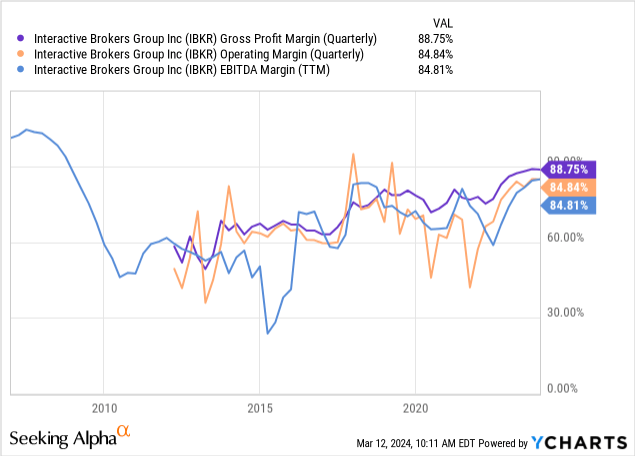
Interactive Brokers has seen a steady improvement in its gross profit margin over the past twelve years. And exactly because of the low operating expenses, its operating margin is not far from its gross profit margin, albeit with higher volatility. On the other hand, its EBITDA margin, although briefly falling to below 30% in 2015, also follows the gross profit margin closely.
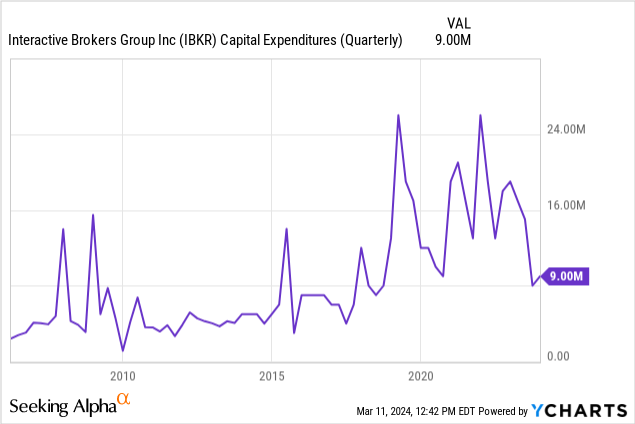
Interactive Brokers have ramped up its CapEx spending during the period before and after ’08 and also before and after 2020. These two periods both had seen dramatic market movements across all financial products. This spending seems to be not only precautions but also post-event adaptations. Currently, the company seems to be done with the latest round of spending for now, and free cash flow has hence received a boost in addition to robust operating cash flow.
The results of robust customer acquisition and lower cost can be shown in its strong free cash flow and net income.

Interactive Brokers: Free Cash Flow vs Net Income (Calculated and charted by Waterside Insight with data from company)
With interest rates set to decline within a year or two, the windfall Interactive Brokers enjoyed in its net interest income will be reduced over time. But as we have seen from its historical data, in the low-interest rate environment, the net interest income was still about half of its revenue. When interest rates are lower, monetary policies are looser, during which the financial markets have an easier time to access to liquidity, and trading volume would increase correspondingly. From the customer acquisition rate in the past few years and the cost comparison, the company shows no sign of slowing down. Interactive Brokers remain a tightly held public company, with over 74% in the hands of management and only 25.4% floating in public. The strong incentives are there to continue to innovate and stay competitive.
Financial Overview & Valuation

Interactive Brokers: Financial Overview (Calculated and charted by Waterside Insight with data from company)
Among Interactive Brokers’ peers, we selected Charles Schwab, Jefferies Financial Group (JEF), and Tradeweb Markets (TW) as comparisons for their P/E ratios. Although they are not exactly apple-to-apple in terms of business operation, the overlaps are strong enough to make sense. It shows currently Interactive Brokers has the lowest P/E ratio at about 14x and this ratio has been trending downwards since 2019 even though its price has gone up by 100% during this period. We don’t think the stock is expensive at the moment. Given the outlook of possible repricing of interest-bearing assets, we think the top-line growth could flat out or slightly decline, but if the repricing is due to a soft landing, the trading volume could be boosted with a better supply of liquidity. Overall, unless the economy falls into a deep recession, Interactive Brokers’ near-term outlook is not in jeopardy.
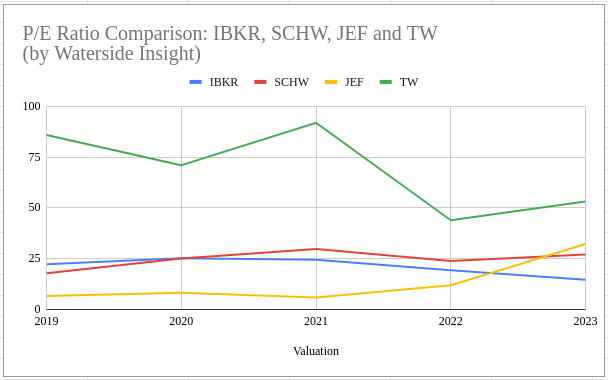
Interactive Brokers: P/E Ratio Comparison with Peers (Calculated and charted by Waterside Insight with data from company)
Conclusion
With over 70% of equity held by its management, Interactive Brokers’ common share investors are basically on a ride to make money alongside its insiders. It has been doing well on the two main revenue streams due to both being competitive in customer acquisition and higher interest rates environment. Both factors won’t have an immediate change in the near term, while in the more likely scenario, the decline of one could result in a pick-up of the other as we explained earlier. As long as it continues to innovate and stay technologically competitive, the stock is not overvalued currently. It may have reached a recent peak, but an imminent decline is not in the picture. We initiate the coverage with a hold.