(NUHY) Trading Report
Longer Term Trading Plans for NUHY
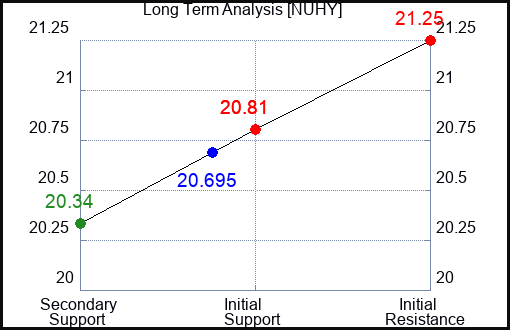
- Buy NUHY slightly over 20.34 target 20.81 stop loss @ 20.28
- Short NUHY slightly under 20.81, target 20.34, stop loss @ 20.87
Swing Trading Plans for NUHY
- Buy NUHY slightly over 20.83, target n/a, Stop Loss @ 20.77
- Short NUHY slightly near 20.83, target 20.34, Stop Loss @ 20.89.
Day Trading Plans for NUHY
- Buy NUHY slightly over 20.83, target 21.25, Stop Loss @ 20.78
- Short NUHY slightly near 20.83, target 20.34, Stop Loss @ 20.88.
Real Time Updates are available on our Nuveen Esg High Yield Corporate Bond Etf (NUHY) Page here: NUHY.
NUHY Ratings for April 13:
| Term → | Near | Mid |
Long |
|---|---|---|---|
| Rating | Neutral | Neutral | Neutral |
| P1 | 0 | 0 | 20.34 |
| P2 | 20.78 | 20.83 | 20.81 |
| P3 | 0 | 21.25 |
Support and Resistance Plot Chart for NUHY
Blue = Current Price
Red= Resistance
Green = Support
Real Time Updates for Repeat Institutional Readers:
Instructions:
-
Click the Get Real Time Updates button below.
-
In the login prompt, select forgot username
-
Type the email you use for Factset
-
Use the user/pass you receive to login
-
You will have 24/7 access to real time updates.
Click the Get Real Time Updates button below.
In the login prompt, select forgot username
Type the email you use for Factset
Use the user/pass you receive to login
You will have 24/7 access to real time updates.
From then on you can just click to get the real time update whenever you want.
Our Market Crash Leading Indicator isEvitar Corte.
-
Evitar Corte warned of market crash risk four times since 2000.
-
It identified the Internet Debacle before it happened.
-
It identified the Credit Crisis before it happened.
-
It identified the Corona Crash too.
-
See what Evitar Corte is Saying Now.
Get Notified When our Ratings Change:Take a Trial
This report was produced using AI developed by Stock Traders Daily. Over the past 20 years this proprietary AI has been refined to help identify the most opportune trading strategies for both individual stocks and the stock markets themselves. This methodology is also applied to Index options, ETFs, and futures. The objective of this specific report is to optimize trading in Nuveen Esg High Yield Corporate Bond Etf (NASDAQ: NUHY) while incorporating prudent risk controls.
Warning:
This is a static report, the data below was valid at the time of the publication, but support and resistance levels for NUHY change over time, so the report should be updated regularly. Real Time updates are provided to subscribers. Unlimited Real Time Reports.
Subscribers also receive market analysis, stock correlation tools, macroeconomic observations, timing tools, and protection from market crashes using Evitar Corte.
Instructions:
Instructions:
The rules that govern the data in this report are the rules of Technical Analysis. For example, if NUHY is testing support buy signals surface, and resistance is the target. Conversely, if resistance is being tested, that is a sign to control risk or short, and support would be the downside target accordingly. In each case, the trigger point is designed to be both an ideal place to enter a position (avoid trading in the middle of a trading channel), and it acts as a level of risk control too.
Swing Trades, Day Trades, and Longer term Trading Plans:
This data is refined to differentiate trading plans for Day Trading, Swing Trading, and Long Term Investing plans for NUHY too. All of these are offered below the Summary Table.
Fundamental Charts for NUHY: